Fig. 5.

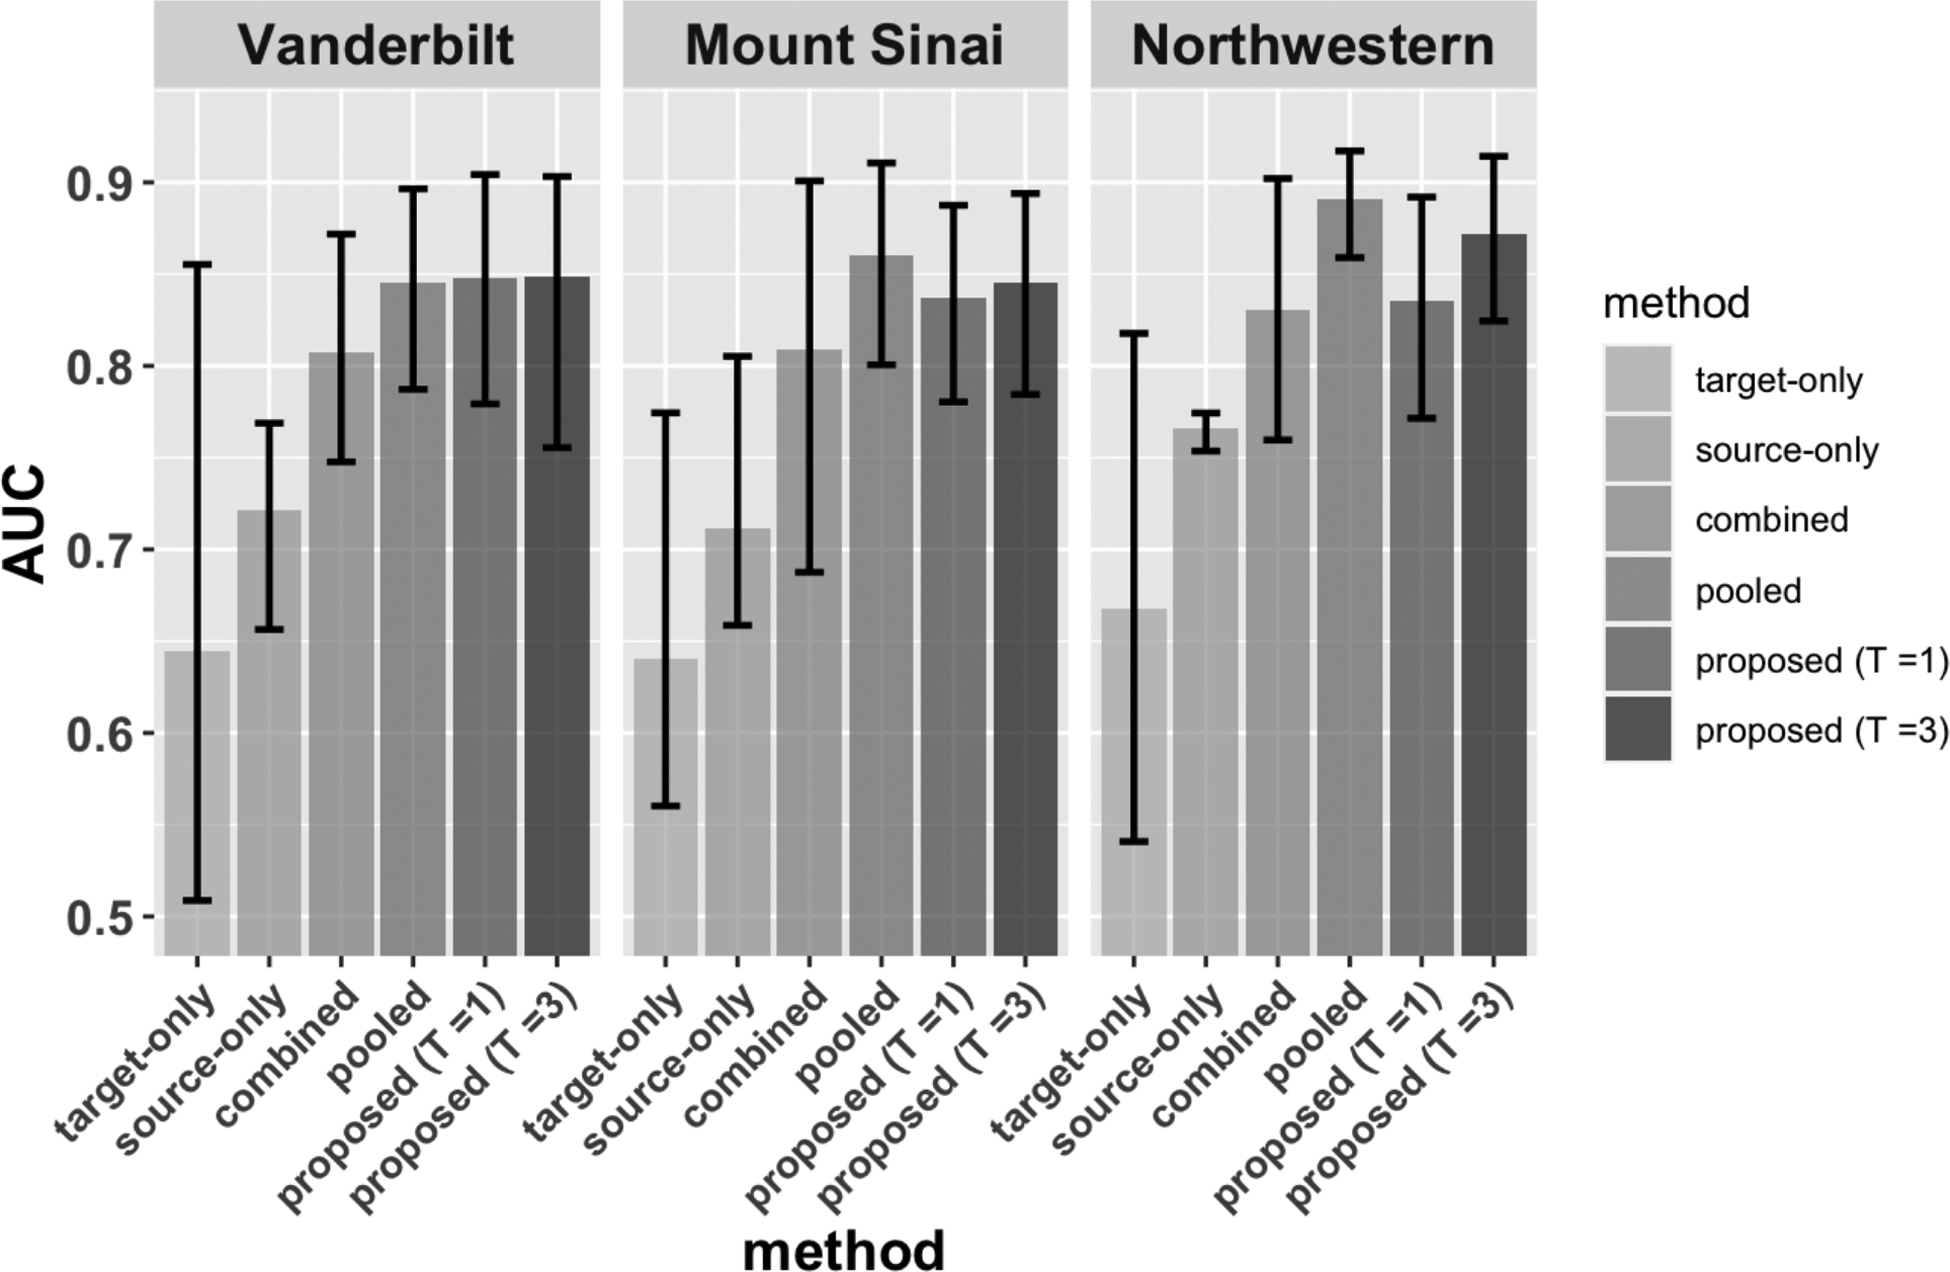
Comparisons of prediction performance across three testing datasets. Each colored bar denoted the average AUC over 20 replications, and the error bar indicates the highest and lowest performance.

Comparisons of prediction performance across three testing datasets. Each colored bar denoted the average AUC over 20 replications, and the error bar indicates the highest and lowest performance.