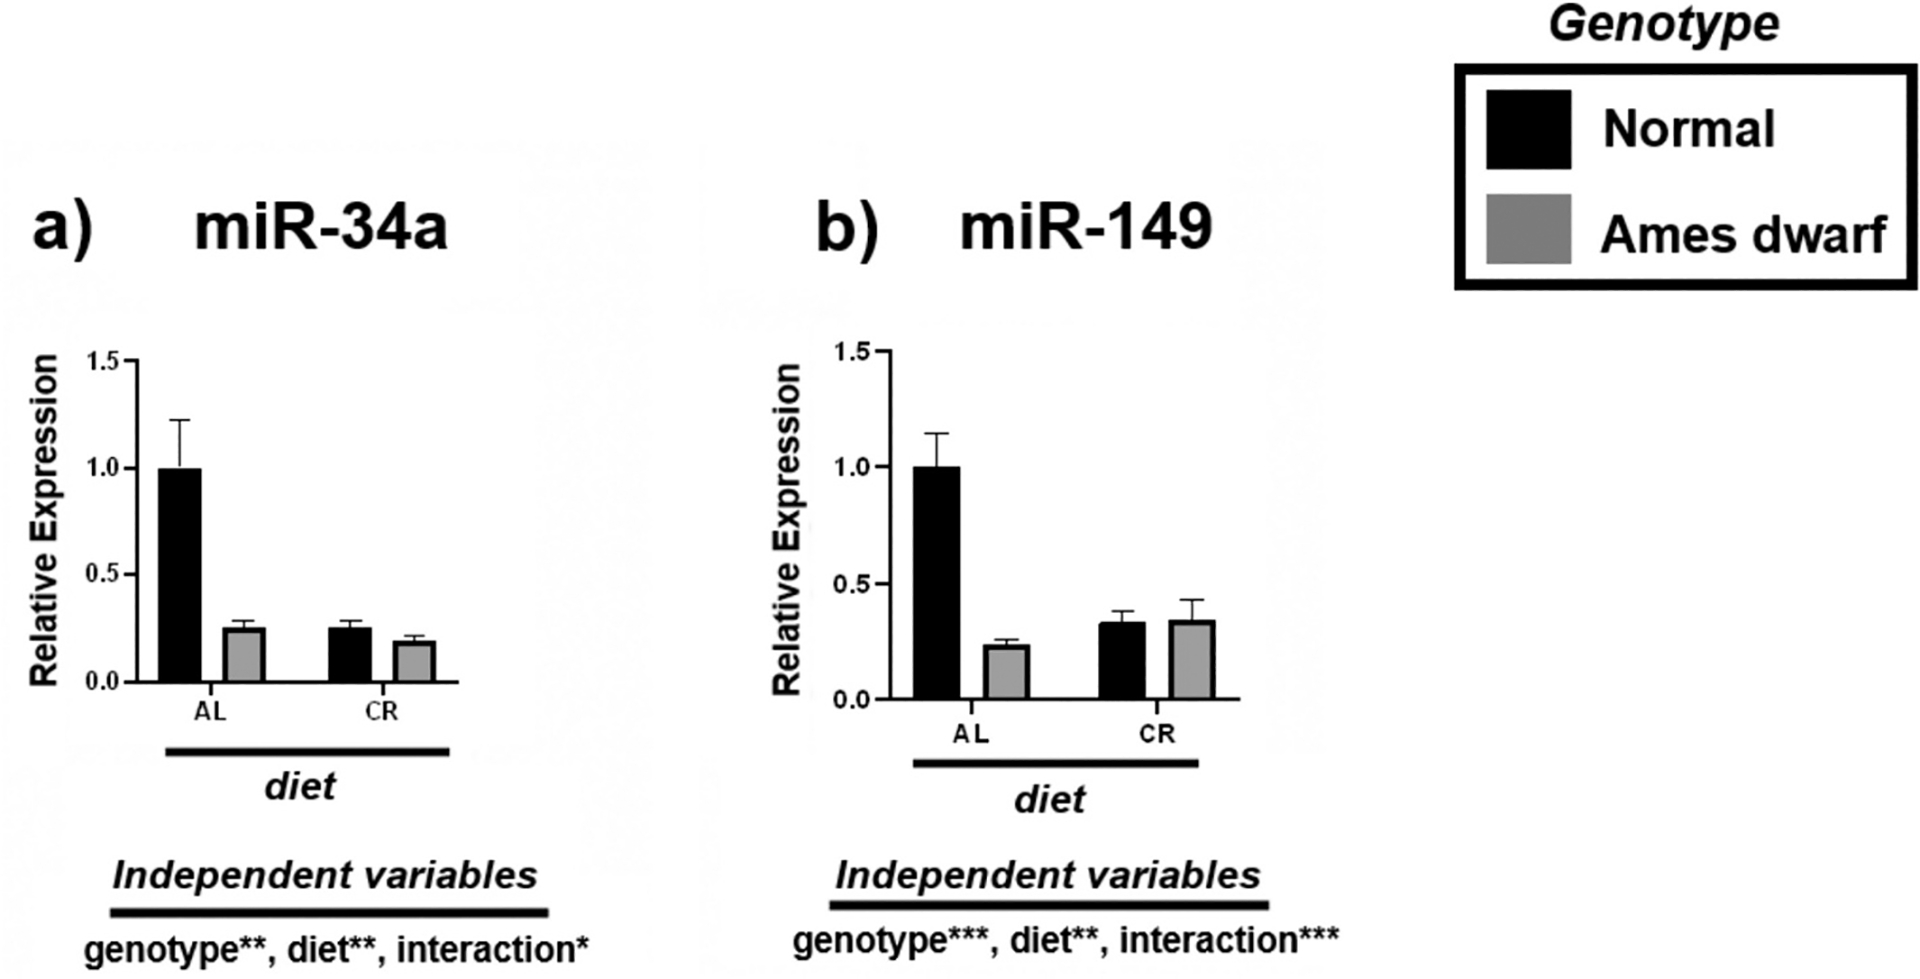
Fig. 1.

Expression of metabolism-associated miRNAs in the liver regulated by genotype (normal or Ames dwarf) and treatment (ad libitum (AL) or caloric restriction (CR)), with y-axis equal to miRNA expression relative to control miR-16, with 8–11 biological replicates. Two-way analysis of variance (ANOVA) was performed with Tukey’s post hoc multiple comparison test using the SigmaPlot v14.0 software. (*) p < 0.05; (**) p < 0.01; (***) p < 0.001; (****) p < 0.0001.
