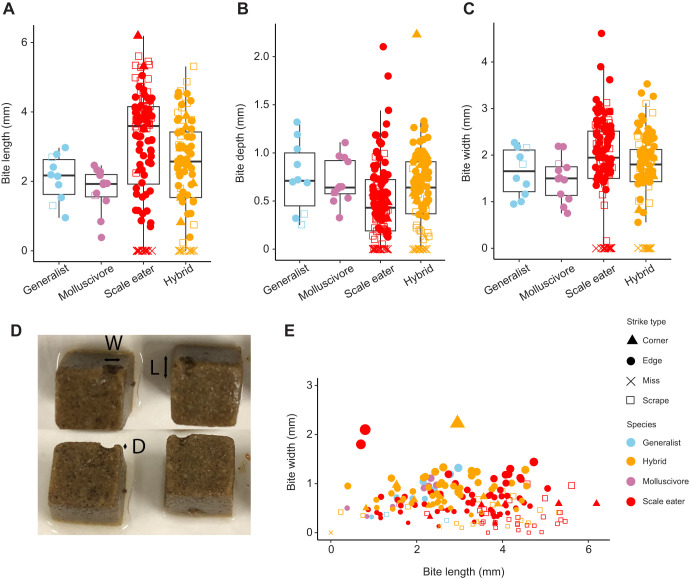
Fig. 2.
Bite dimensions. (A–C) Boxplots (median, upper and lower quartiles and 1.5× interquartile range) overlaid with raw data show the three bite dimensions (A, length; B, depth; C, width) across each species or hybrid cross. Strike type is indicated by symbol shape. (D) Top-down and side views of typical bites from Repashy gelatin cubes following a single strike. Bite dimensions (L, length; D, depth; W, width) are labeled and were measured immediately after each strike using digital calipers under a stereomicroscope. (E) Scatterplot of bite width by depth with species and strike type indicated by symbol color and shape, respectively. The relative size of each point is proportional to the depth of the bite.

