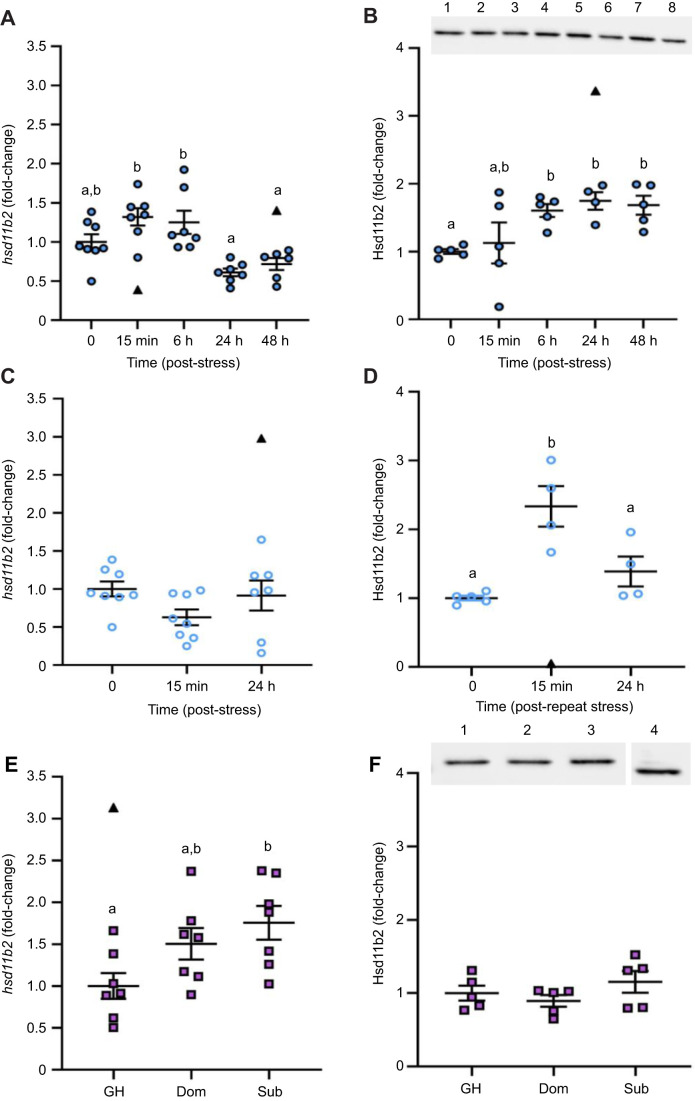
Fig. 2.
The effects of stress on hsd11b2 mRNA and Hsd11b2 protein abundance in the adult zebrafish brain. Changes in brain hsd11b2 transcript and Hsd11b2 protein abundance following an acute stressor (A,B), a repeat acute stressor (C,D) and a chronic stressor (E,F). Gene expression was quantified either in brain zone 2 (telencephalon and olfactory bulbs removed; A,C) or in whole brain (E). In B, a representative western blot for acute and repeat acute stress is provided (lane 1=0 min, 2=15 min, 3=6 h, 4=24 h and 6=48 h post-acute stress; lane 5=15 min, 7=24 h post-repeat acute stress; lane 8=internal control). The full blots are provided in Fig. S2. In F, a representative western blot for chronic stress is provided [lane 1=group housed (GH), 2=dominant (Dom), 3=subordinate (Sub), 4=internal control from the same blot]. Transcript abundance was normalized to the mean expression of the two housekeeping genes (ef1α and rpl8). Protein expression of Hsd11b2 was normalized to total protein. Data are shown as individual data points with a solid line and whiskers representing the mean±s.e.m. (hsd11b2, acute stress n=6–8, repeat acute stress n=7–8, social stress n=7; Hsd11b2, acute stress n=4–5, repeat acute stress n=4–5, social stress n=5). Data points identified as statistical outliers were removed prior to analysis and are shown as black triangles. Differences in hsd11b2 mRNA and Hsd11b2 protein levels were determined by one-way ANOVA followed by a Tukey's post hoc test, except for Hsd11b2 protein abundance under acute stress (B), where a Kruskal–Wallis followed by a Dunn's post hoc test was used (P<0.05). Within each panel, groups that do not share a common letter are significantly different from one another.

