Fig. 3.
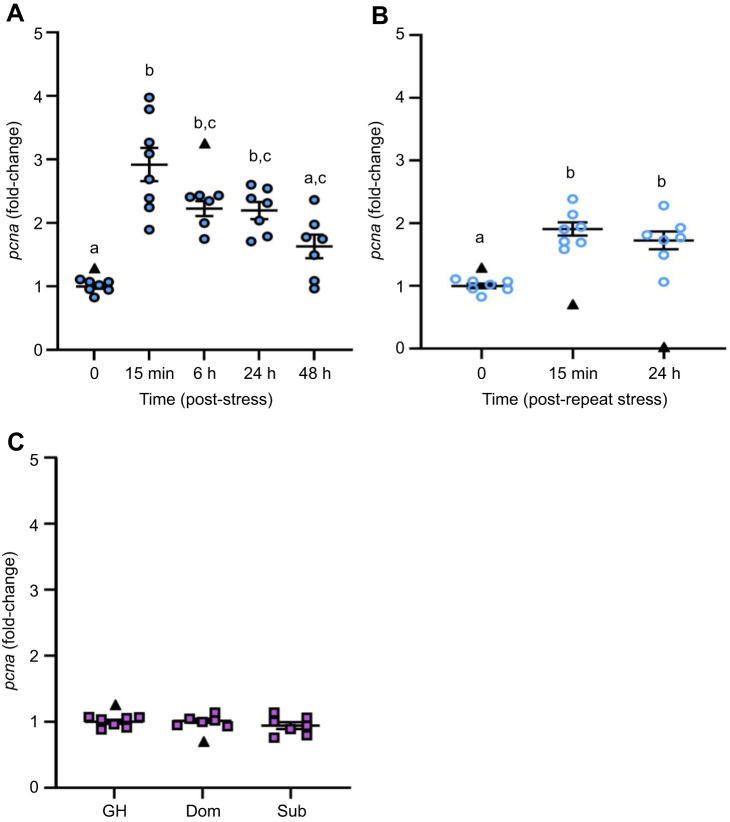
The effects of stress on pcna transcript abundance in the adult zebrafish brain. (A) Zebrafish were exposed to air for 1 min and allowed to recover for up to 48 h (filled blue circles). (B) For a separate group of fish, the stressor was repeated 24 h after the first stressor and fish were allowed to recover for 15 min or 24 h (open blue circles). (C) Dominant (Dom) and subordinate (Sub) zebrafish after 24 h of social stress; group-housed (GH) fish are included as a control (purple squares). pcna transcript abundance in brain zone 2 (telencephalon and olfactory bulbs removed; A,B) and whole brain (C) was normalized to the mean expression of the two housekeeping genes (ef1α and rpl8). Data are shown as individual data points with a solid line and whiskers representing the mean±s.e.m., and statistical outliers as black triangles. Differences in pcna transcript abundance were determined by one-way ANOVA with a Tukey's post hoc test, except for acute stress, where a Kruskal–Wallis with a Dunn's post hoc test was used (P<0.05). Within each panel, groups that do not share a common letter are significantly different from one another.

