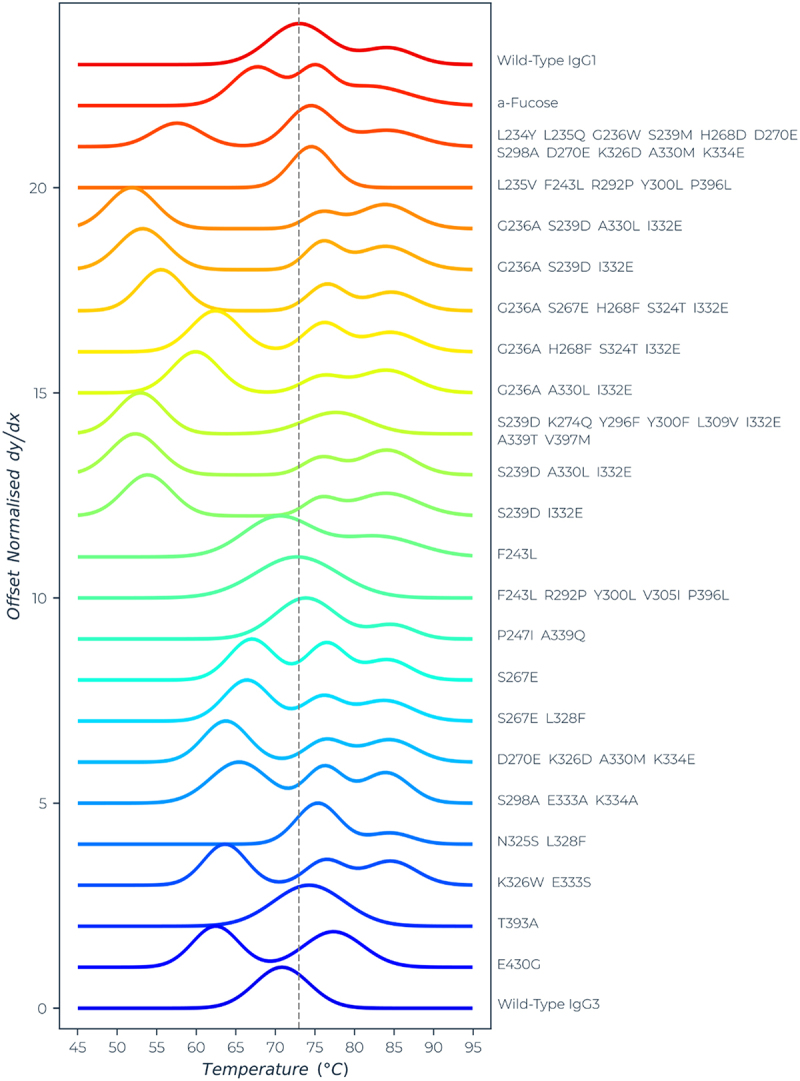
Figure 1.

Thermal stability of CD20 antibodies measured by differential scanning fluorimetry. The melt curves (normalized, and offset, first differential) are shown for each sample. The dashed line is aligned with the Tm1 value of the wild-type IgG1 mAb. The corresponding Ton and Tm for the first transition are reported in Table 2.
