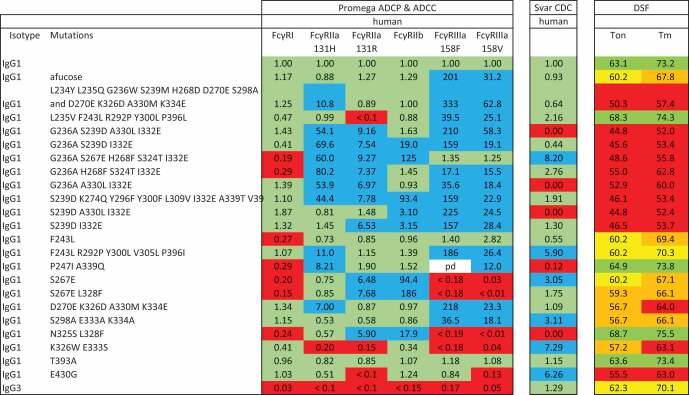
Table 2.
Relative activity of CD20 antibodies in cell-based assays for ADCP potential, ADCC potential or CDC and thermal stability measured by DSF. The activity assays are normalized and expressed as a ratio of the EC50 of wild-type IgG1 to the EC50 of the sample. Cells are shaded to indicate the response range: green = within three-fold, blue = greater than three-fold, red = less than three-fold. For the DSF assays, the onset of denaturation (Ton) and first melting point (Tm) is reported. Cells are shaded to indicate the temperature compared with wild-type IgG1 (Ton = 63.1°C, Tm = 73.2°C): Ton green = greater than 61.9°C), yellow = 60°C to 61.9°C, orange = 56°C to 60°C, red = less than 56°C. Tm green = greater than 72.6°C), yellow = 70°C to 72.6°C, orange = 66°C to 70°C, red = less than 66°C. pd = point dropped due to technical failure.
 |
