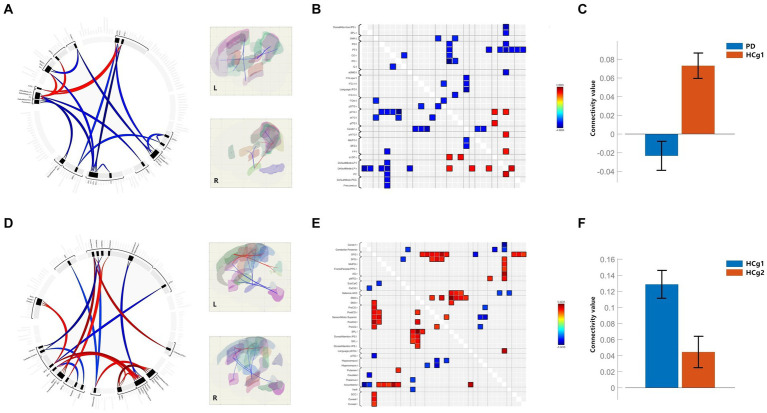
Figure 2.
(A–C) Are the functional connectivity results for the comparison of PD with HCg1; (B) is the functional connectivity matrix plot; (C) is the histogram of the average functional connectivity values for both groups; (D–F) are the functional connectivity results for the comparison of HCg1 with HCg2; (E) is the functional connectivity matrix plot; F is a histogram of the mean connectivity values between HCg1 and HCg2. L/l, Left; R/r, Right; IPS=Intraparietal sulci; SPL, Superior Parietal Lobule; PO=Parietal Operculum Cortex; PT, Planum Temporale; CO=Central Opercular Cortex; IC, insular Cortex; aSMG, Supramarginal Gyrus, anterior division; IFG oper, Inferior Frontal Gyrus, pars percularis; IFG tri, Inferior Frontal Gyrus, pars triangularis; FOrb, Frontal Orbital Cortex; pSTG, Superior Temporal Gyrus, posterior division; pITG, Inferior Temporal Gyrus, posterior division; aITG, Inferior Temporal Gyrus, anterior division; Cereb1, Cerebelum Crus1; pMTG, Middle Temporal Gyrus, posterior division; MidFG, Middle Frontal Gyrus; SFG, Superior Frontal Gyrus; FP, Frontal Pole; sLOC, Lateral Occipital Cortex, superior division; LP=; PC, Cingulate Gyrus, posterior division; PCC, Posterior Cingulate Cortex; AG, Angular Gyrus; SMA, Supplementary Motor Area; PreCG, Precentral Gyrus; PosCG, Postcentral Gyrus; SPL, Superior Parietal Lobule; Ver6, Vermis 6; SCC, Supracalcarine Cortex.

