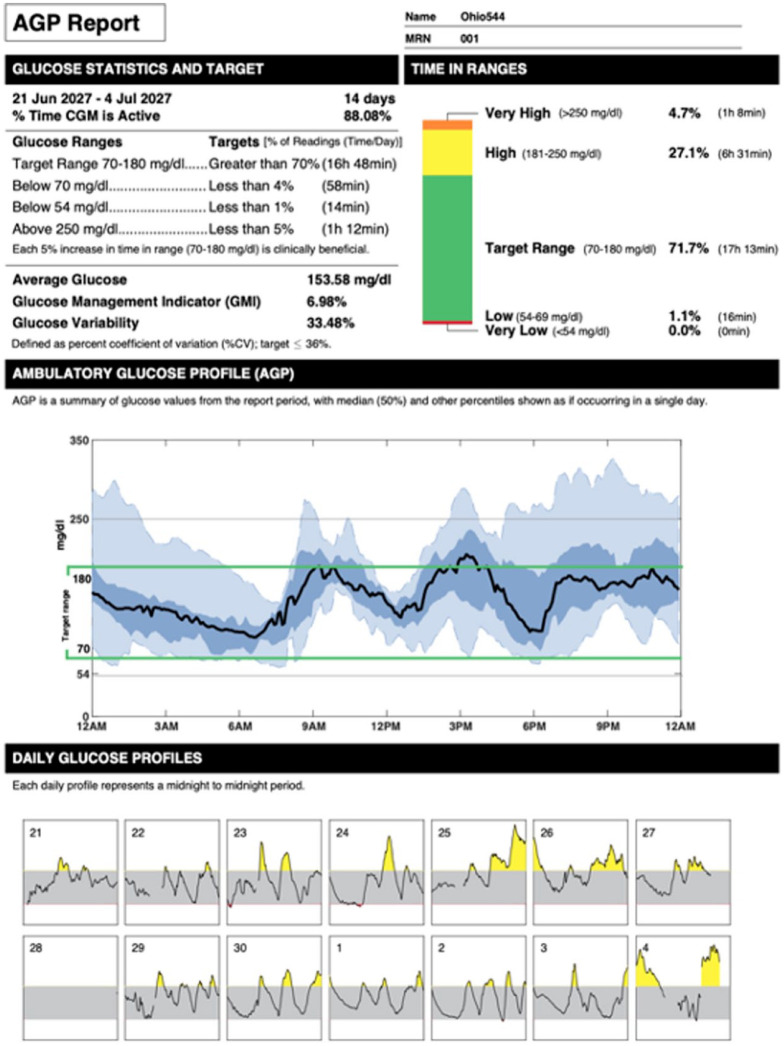
Figure 4.
AGP report (plot VIII) of two weeks of data of a representative subject (Ohio 544). The upper panels report several CGM-derived metrics together with their ideal target values. The middle panel combines the daily glucose profiles to make a 24-hour summary of glucose data. The bottom panel reports each single daily glucose profile and highlights the presence of hyperglycemia (in yellow) and hypoglycemia (in red).
Abbreviations: AGP, ambulatory glucose profile; CGM, continuous glucose monitoring; CV, coefficient of variation.

