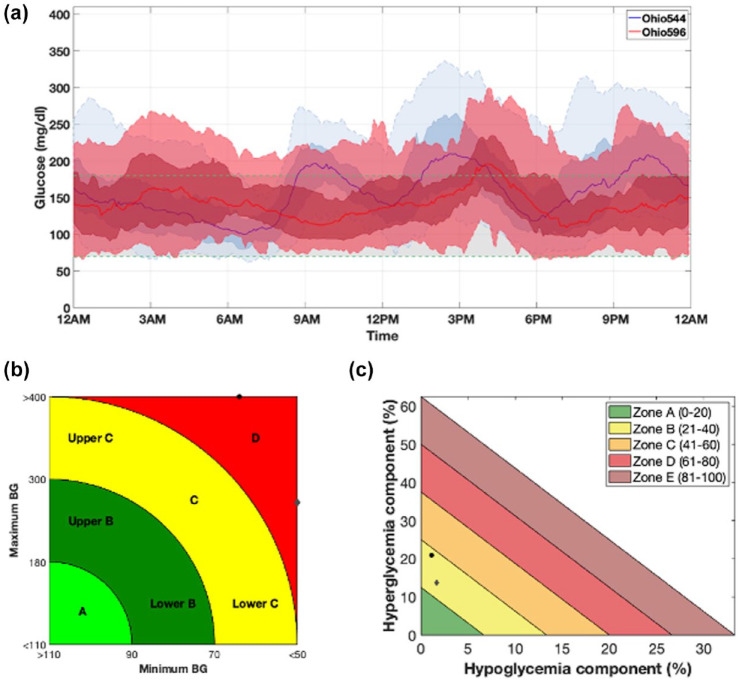
Figure 5.
Comparison between CGM data of two representative subjects (Ohio544 and Ohio596) obtained using AGATA’s utilities. Panel (a) (plot III) compares the daily glucose profile distributions highlighted in blue for Ohio544 and in red for Ohio596, in terms of median, 25th to 75th percentile, and 5th to 95th percentile. Panels (b and c) compare the CVGA and GRI of the two subjects where data of Ohio544 and Ohio596 are reported as black circles and gray diamonds, respectively.
Abbreviations: CGM, continuous glucose monitoring; AGATA, Automated Glucose dATa Analysis; CVGA, control variability glucose analysis; GRI, glycemic risk index; BG, blood glucose.

