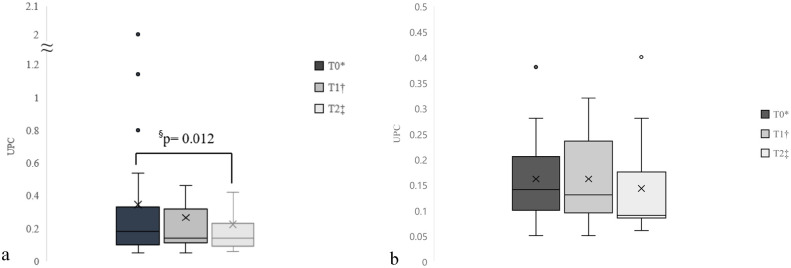
Figure 1.
Box and whisker plots showing (a) urine protein:creatinine ratio (UPC) at three time points in 21 cats treated with toceranib and (b) UPC measurements at three time points in 17 cats without pre-existing proteinuria treated with toceranib. The boxes extend from the first to the third quartile, x denotes the mean and the horizontal black lines within each box denote median values. The whiskers denote minimum and maximum values; dots denote outliers. *T0 defined as baseline before toceranib administration. †T1 defined as 28 days after toceranib administration. ‡T2 defined as 56 days after toceranib administration. §denotes a statistically significant difference in UPC. ≈ represents a break in the graph axis

