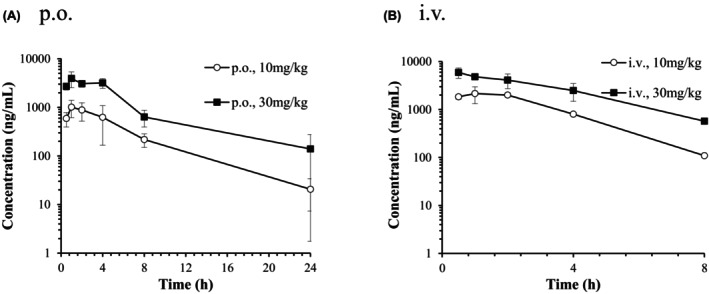
FIGURE 5.

Plasma concentration‐time curves of unchanged form after a single oral (A) or intravenous (B) administration of RIF to male PXB mice. Each point and bar are represented as mean ± SD (n = 3). Some points are represented by mean of two (0.5 and 8 h after 10 mg/kg, i.v.; 4 h after 30 mg/kg, i.v.) or by one sample (4 h after 10 mg/kg, i.v.).
