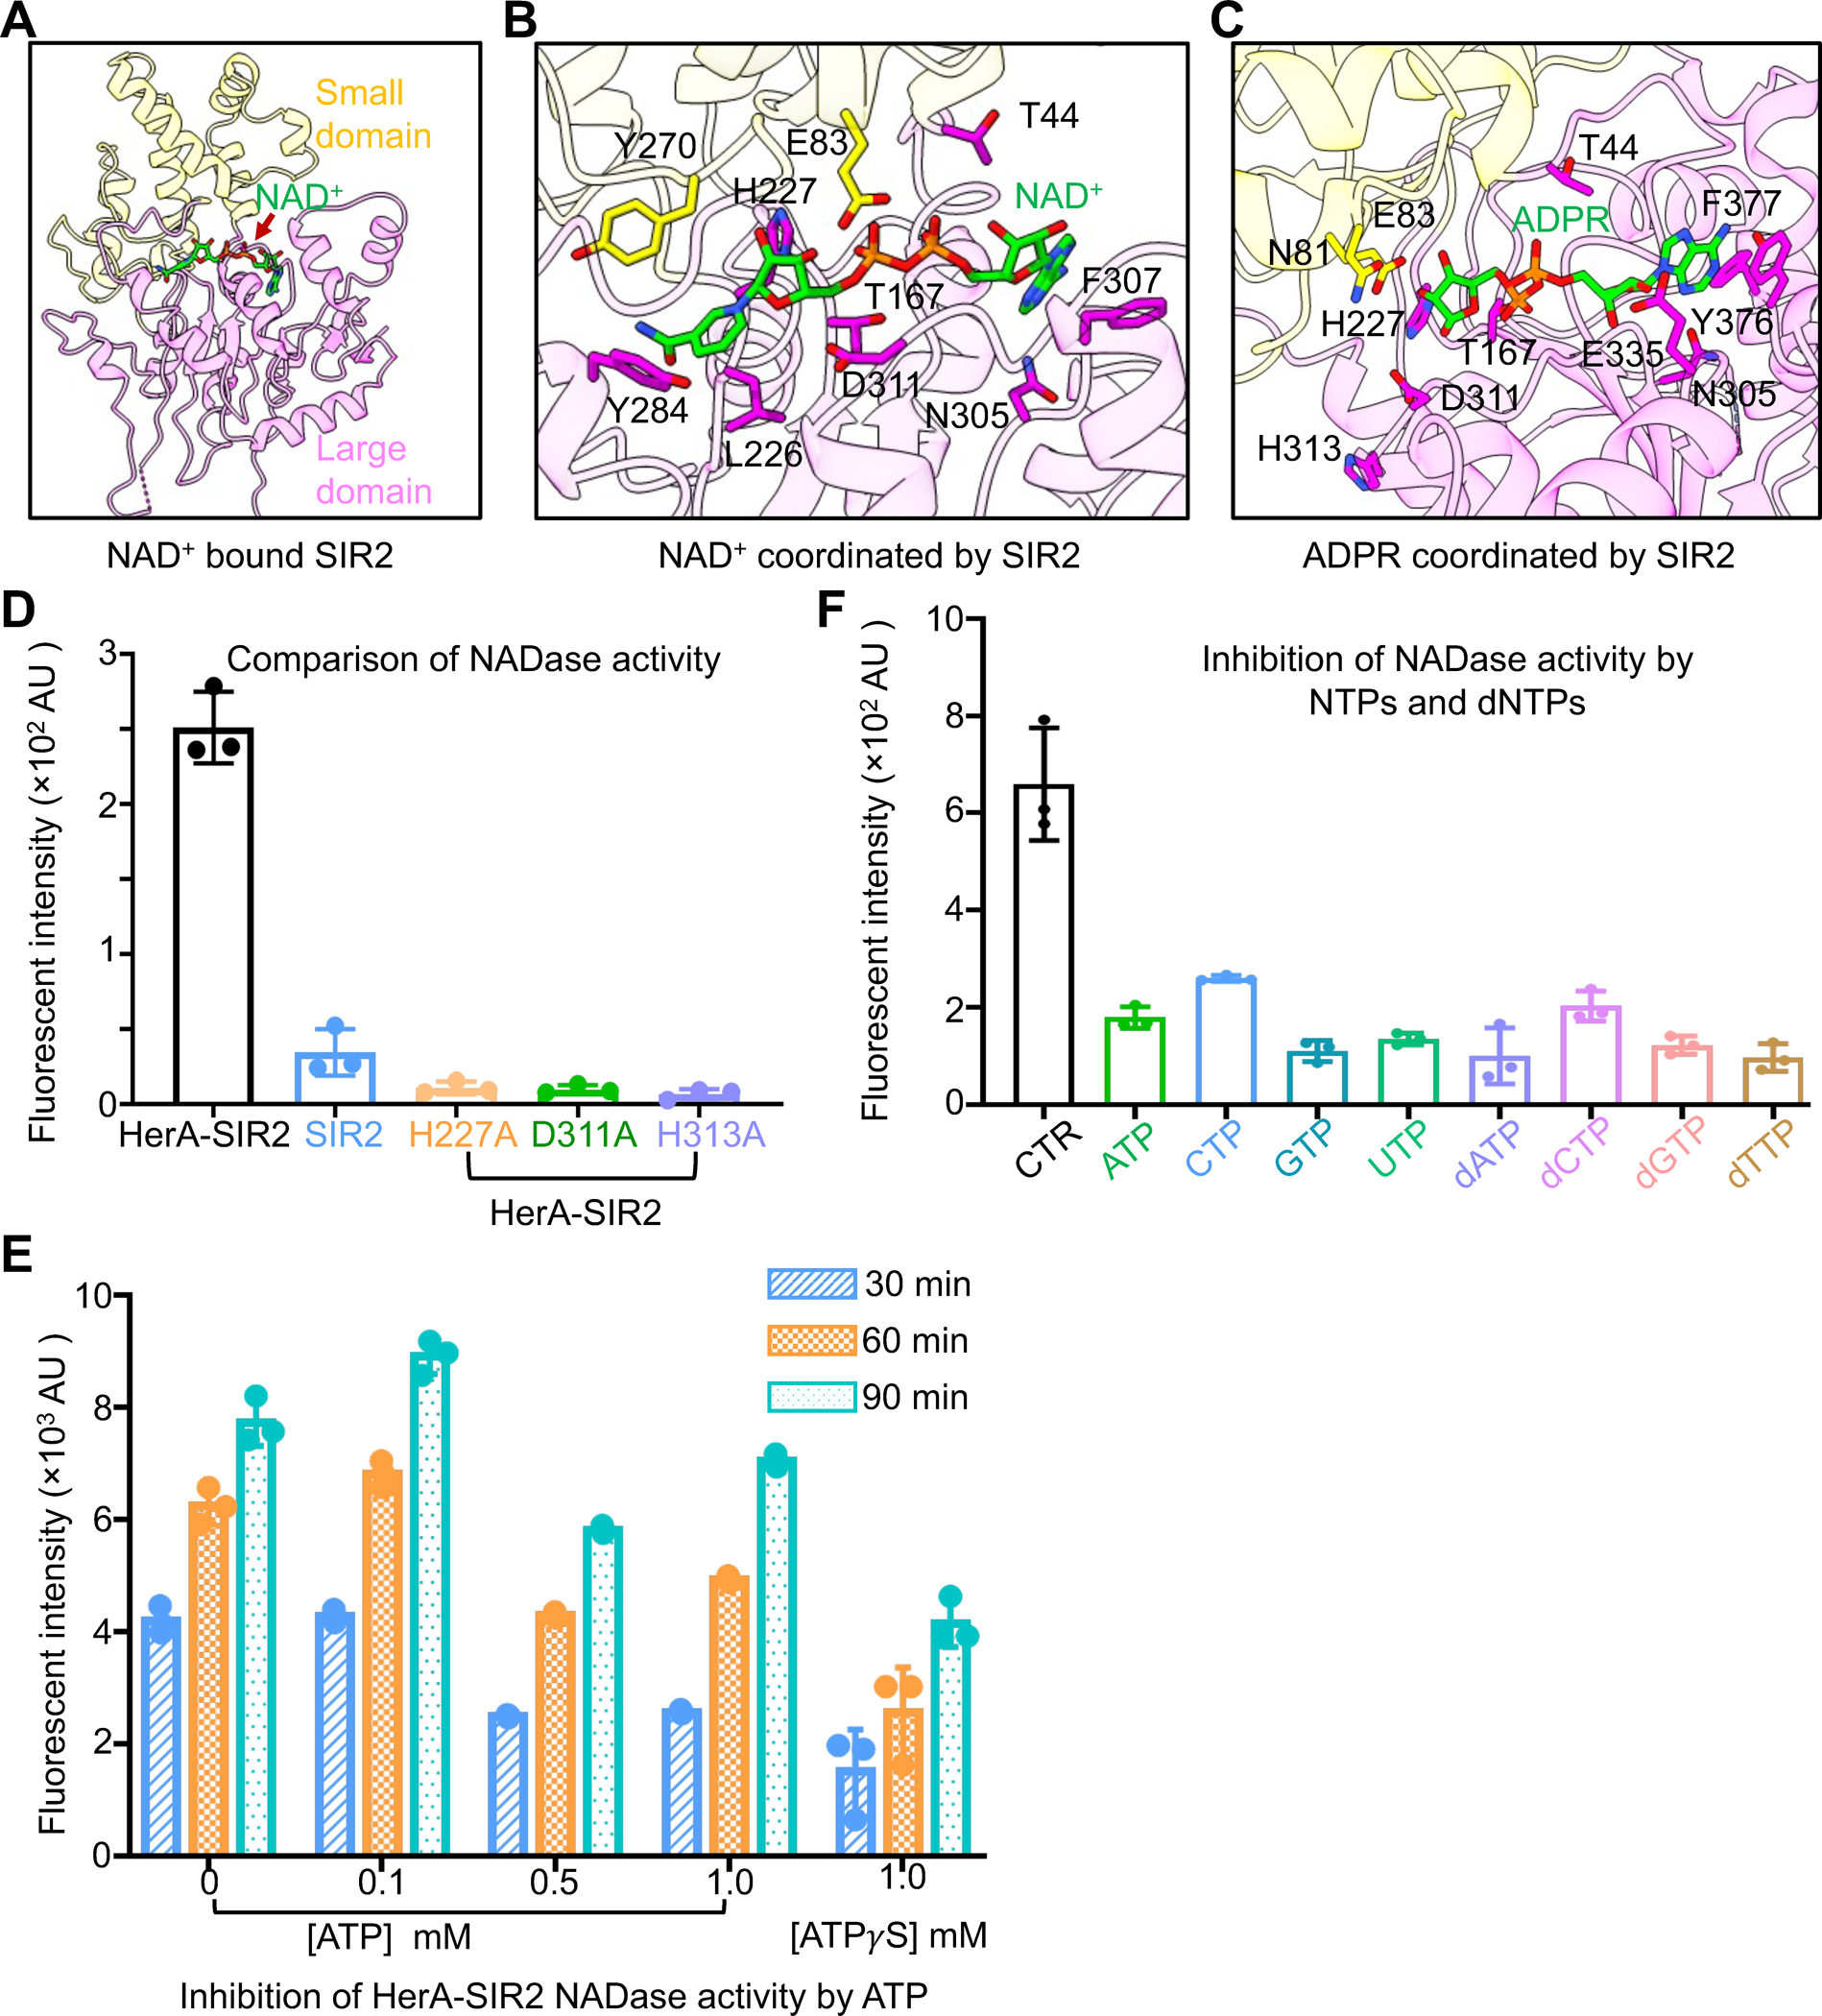
Figure 3. Mechanism of SIR2 catalysis.

(A) NAD+ bins to the interface of the small domain and the large domain of SIR2.
(B) An expanded view of NAD+ coordination by key residues of SIR2.
(C) An expanded view of ADPR coordination by key residues of SIR2.
(D) Comparison of NAD+ hydrolase activity between HerA-SIR2 complex, HerA-SIR2H227A, HerA-SIR2D311A, HerA-SIR2H313A, and SIR2 apo dodecamer at 30 minutes. Mutations of residues impaired NAD+ hydrolysis. Data are mean ± SD from 3 replicates as indicated.
(E) Effects of ATP and ATPγS on NAD+ hydrolase activity of the HerA-SIR2 complex at different time points. Data are mean ± SD from 3 replicates as indicated.
(F) Effects of NTPs and dNTPs on NAD+ hydrolase activity of the HerA-SIR2 complex at 30 minutes. Data are mean ± SD from 3 replicates as indicated.
See also Figures S5.
