
Figure 1.
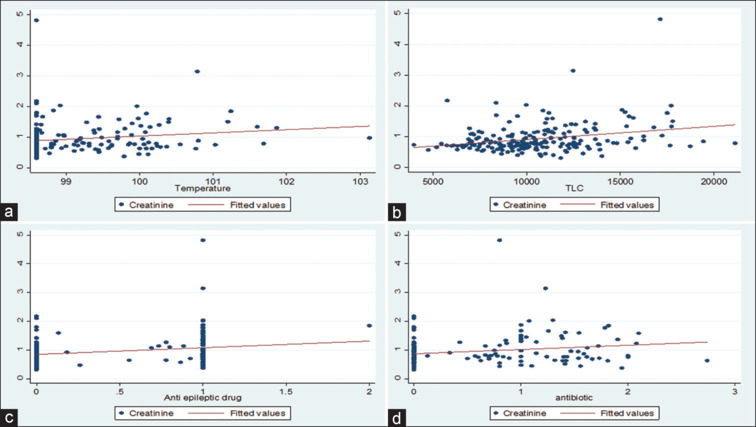
Scatter plot showing correlation of rise in creatinine with Temperature (a), Rise in Total Leucocyte Count (TLC) (b), Number of antiepileptic drugs (c) and Number of Antibiotics (d)
Official websites use .gov
A
.gov website belongs to an official
government organization in the United States.
Secure .gov websites use HTTPS
A lock (
) or https:// means you've safely
connected to the .gov website. Share sensitive
information only on official, secure websites.
Scatter plot showing correlation of rise in creatinine with Temperature (a), Rise in Total Leucocyte Count (TLC) (b), Number of antiepileptic drugs (c) and Number of Antibiotics (d)