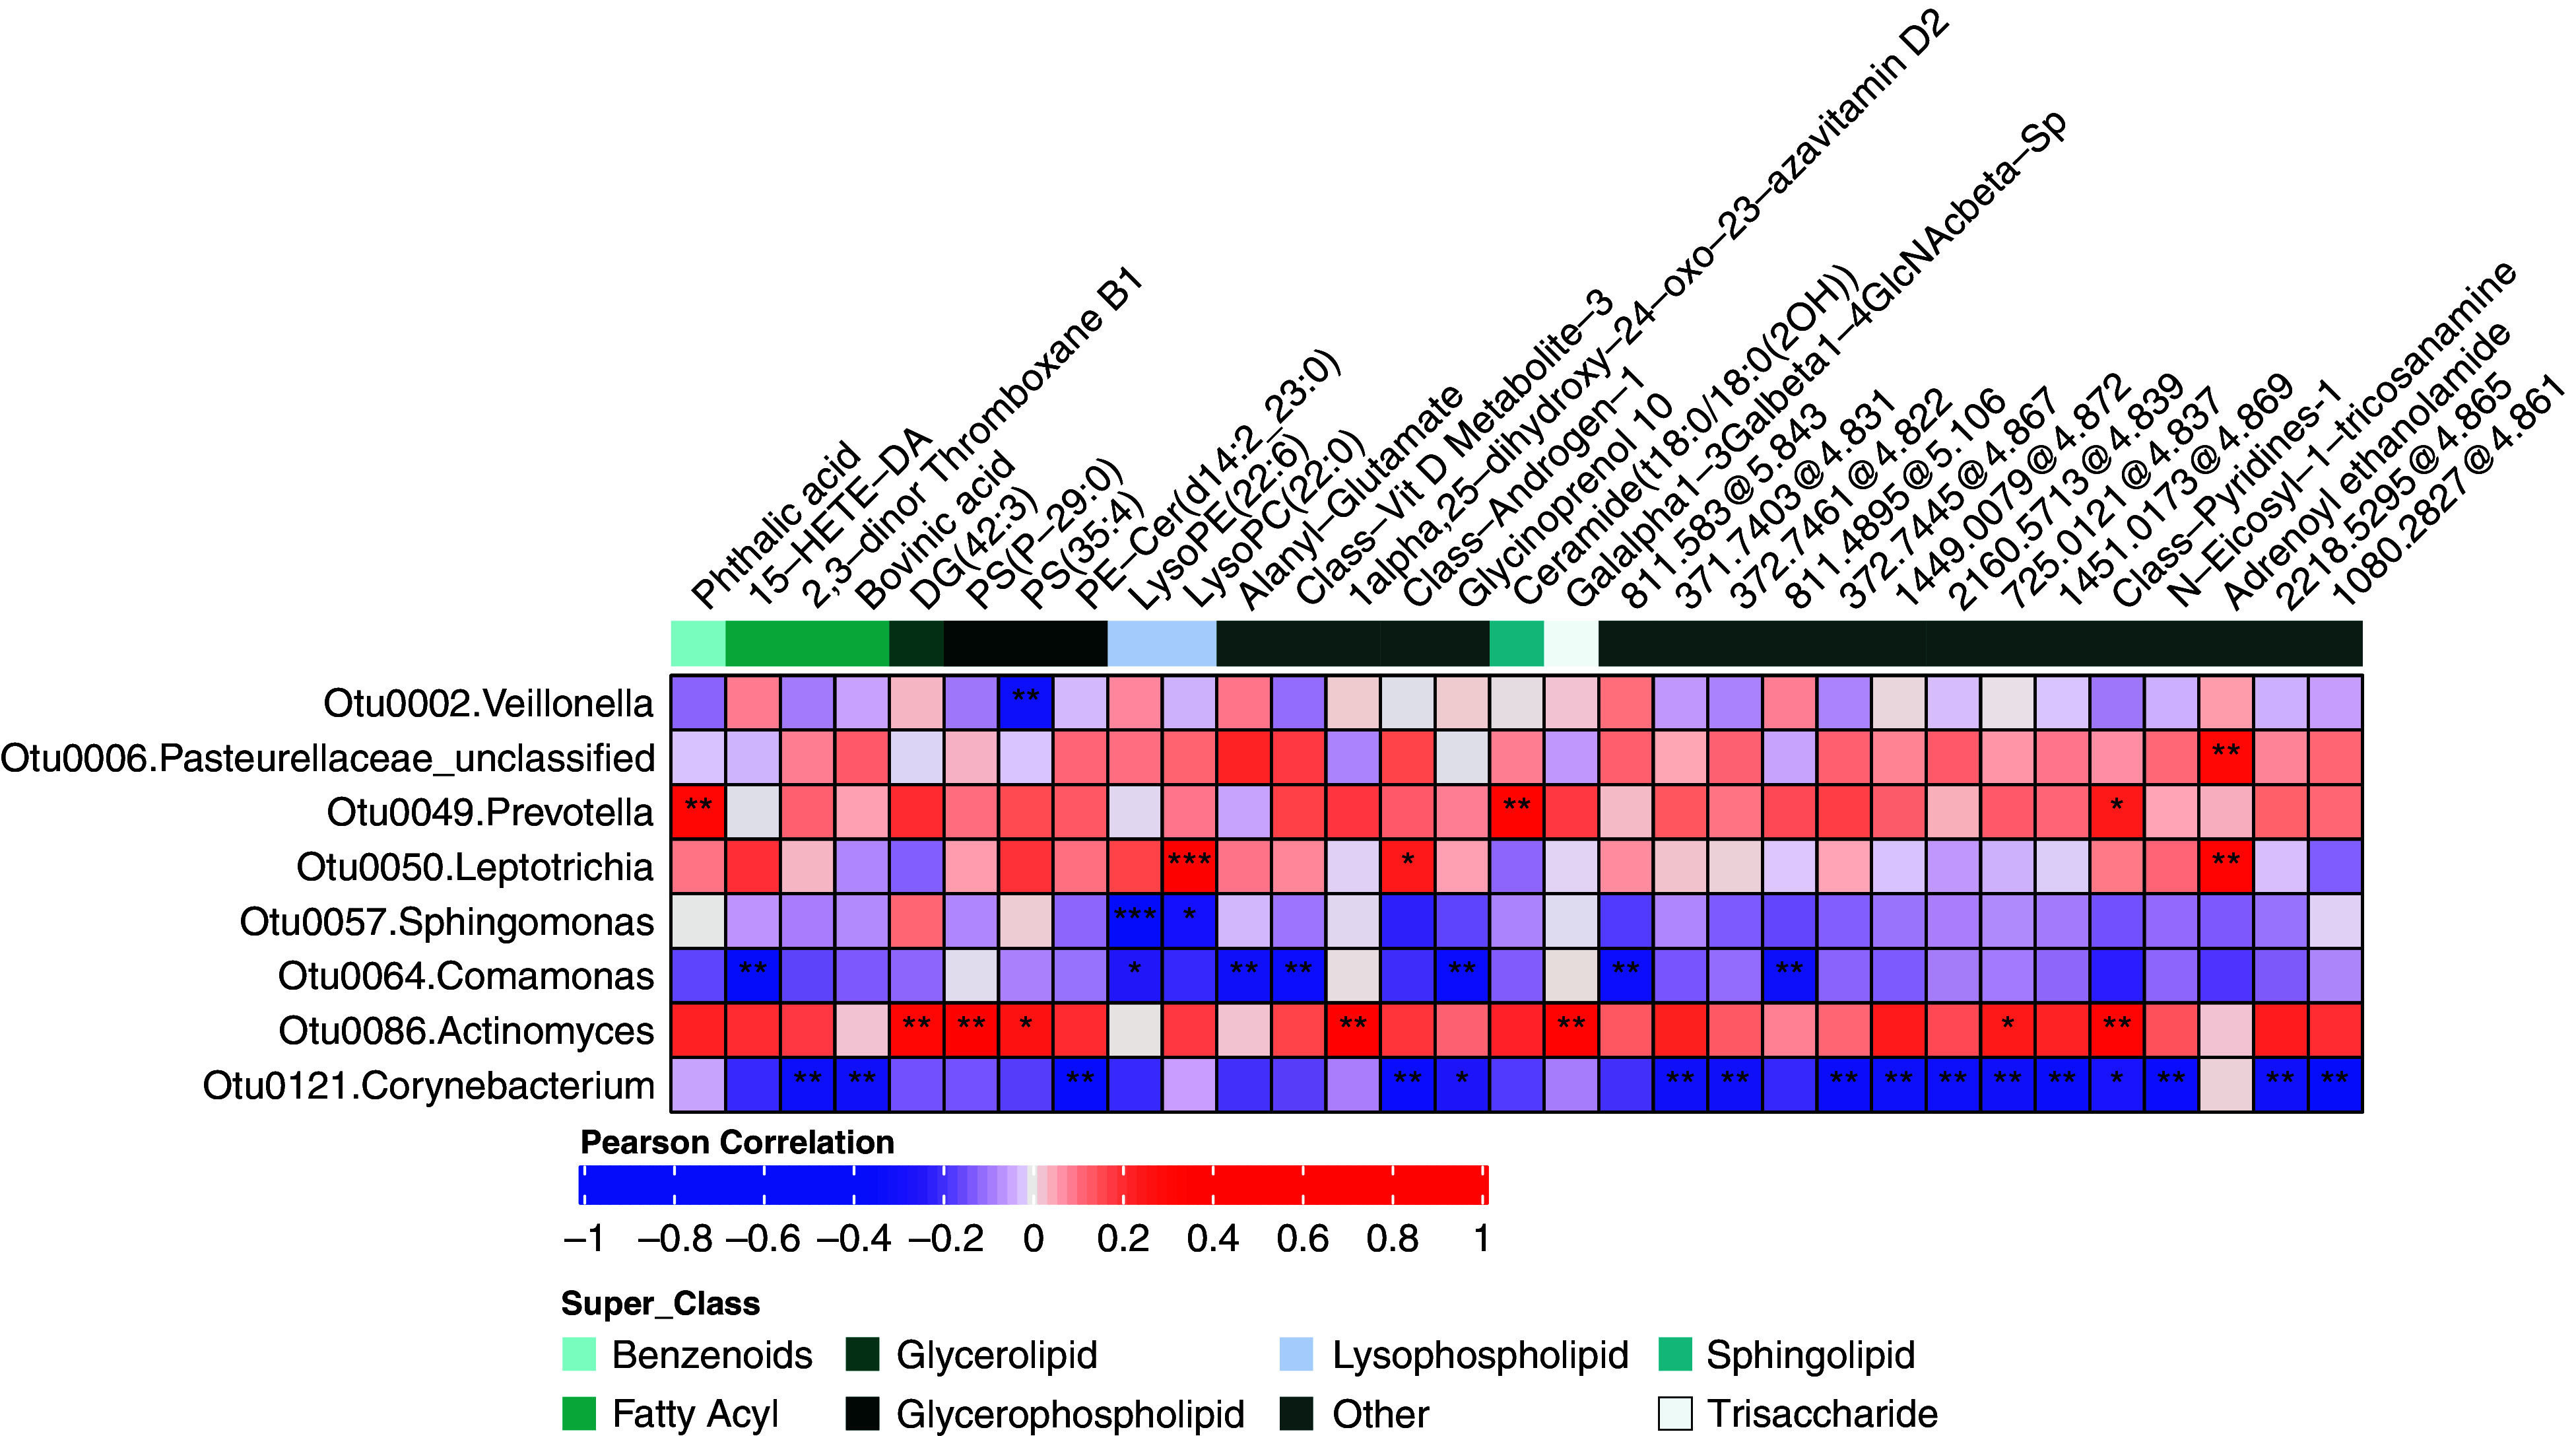
Figure 2.

Correlation heatmap between lung microbiota and untargeted metabolomics features that were most strongly associated with the clinical measures. Only OTUs and metabolites having at least one significant correlation based on Padj < 0.01 (Benjamini–Hochberg corrected) are shown. *0.01 ⩽ Padj < 0.05, **0.001 ⩽ Padj < 0.01, and ***Padj < 0.001. OTU = operational taxonomic unit.
