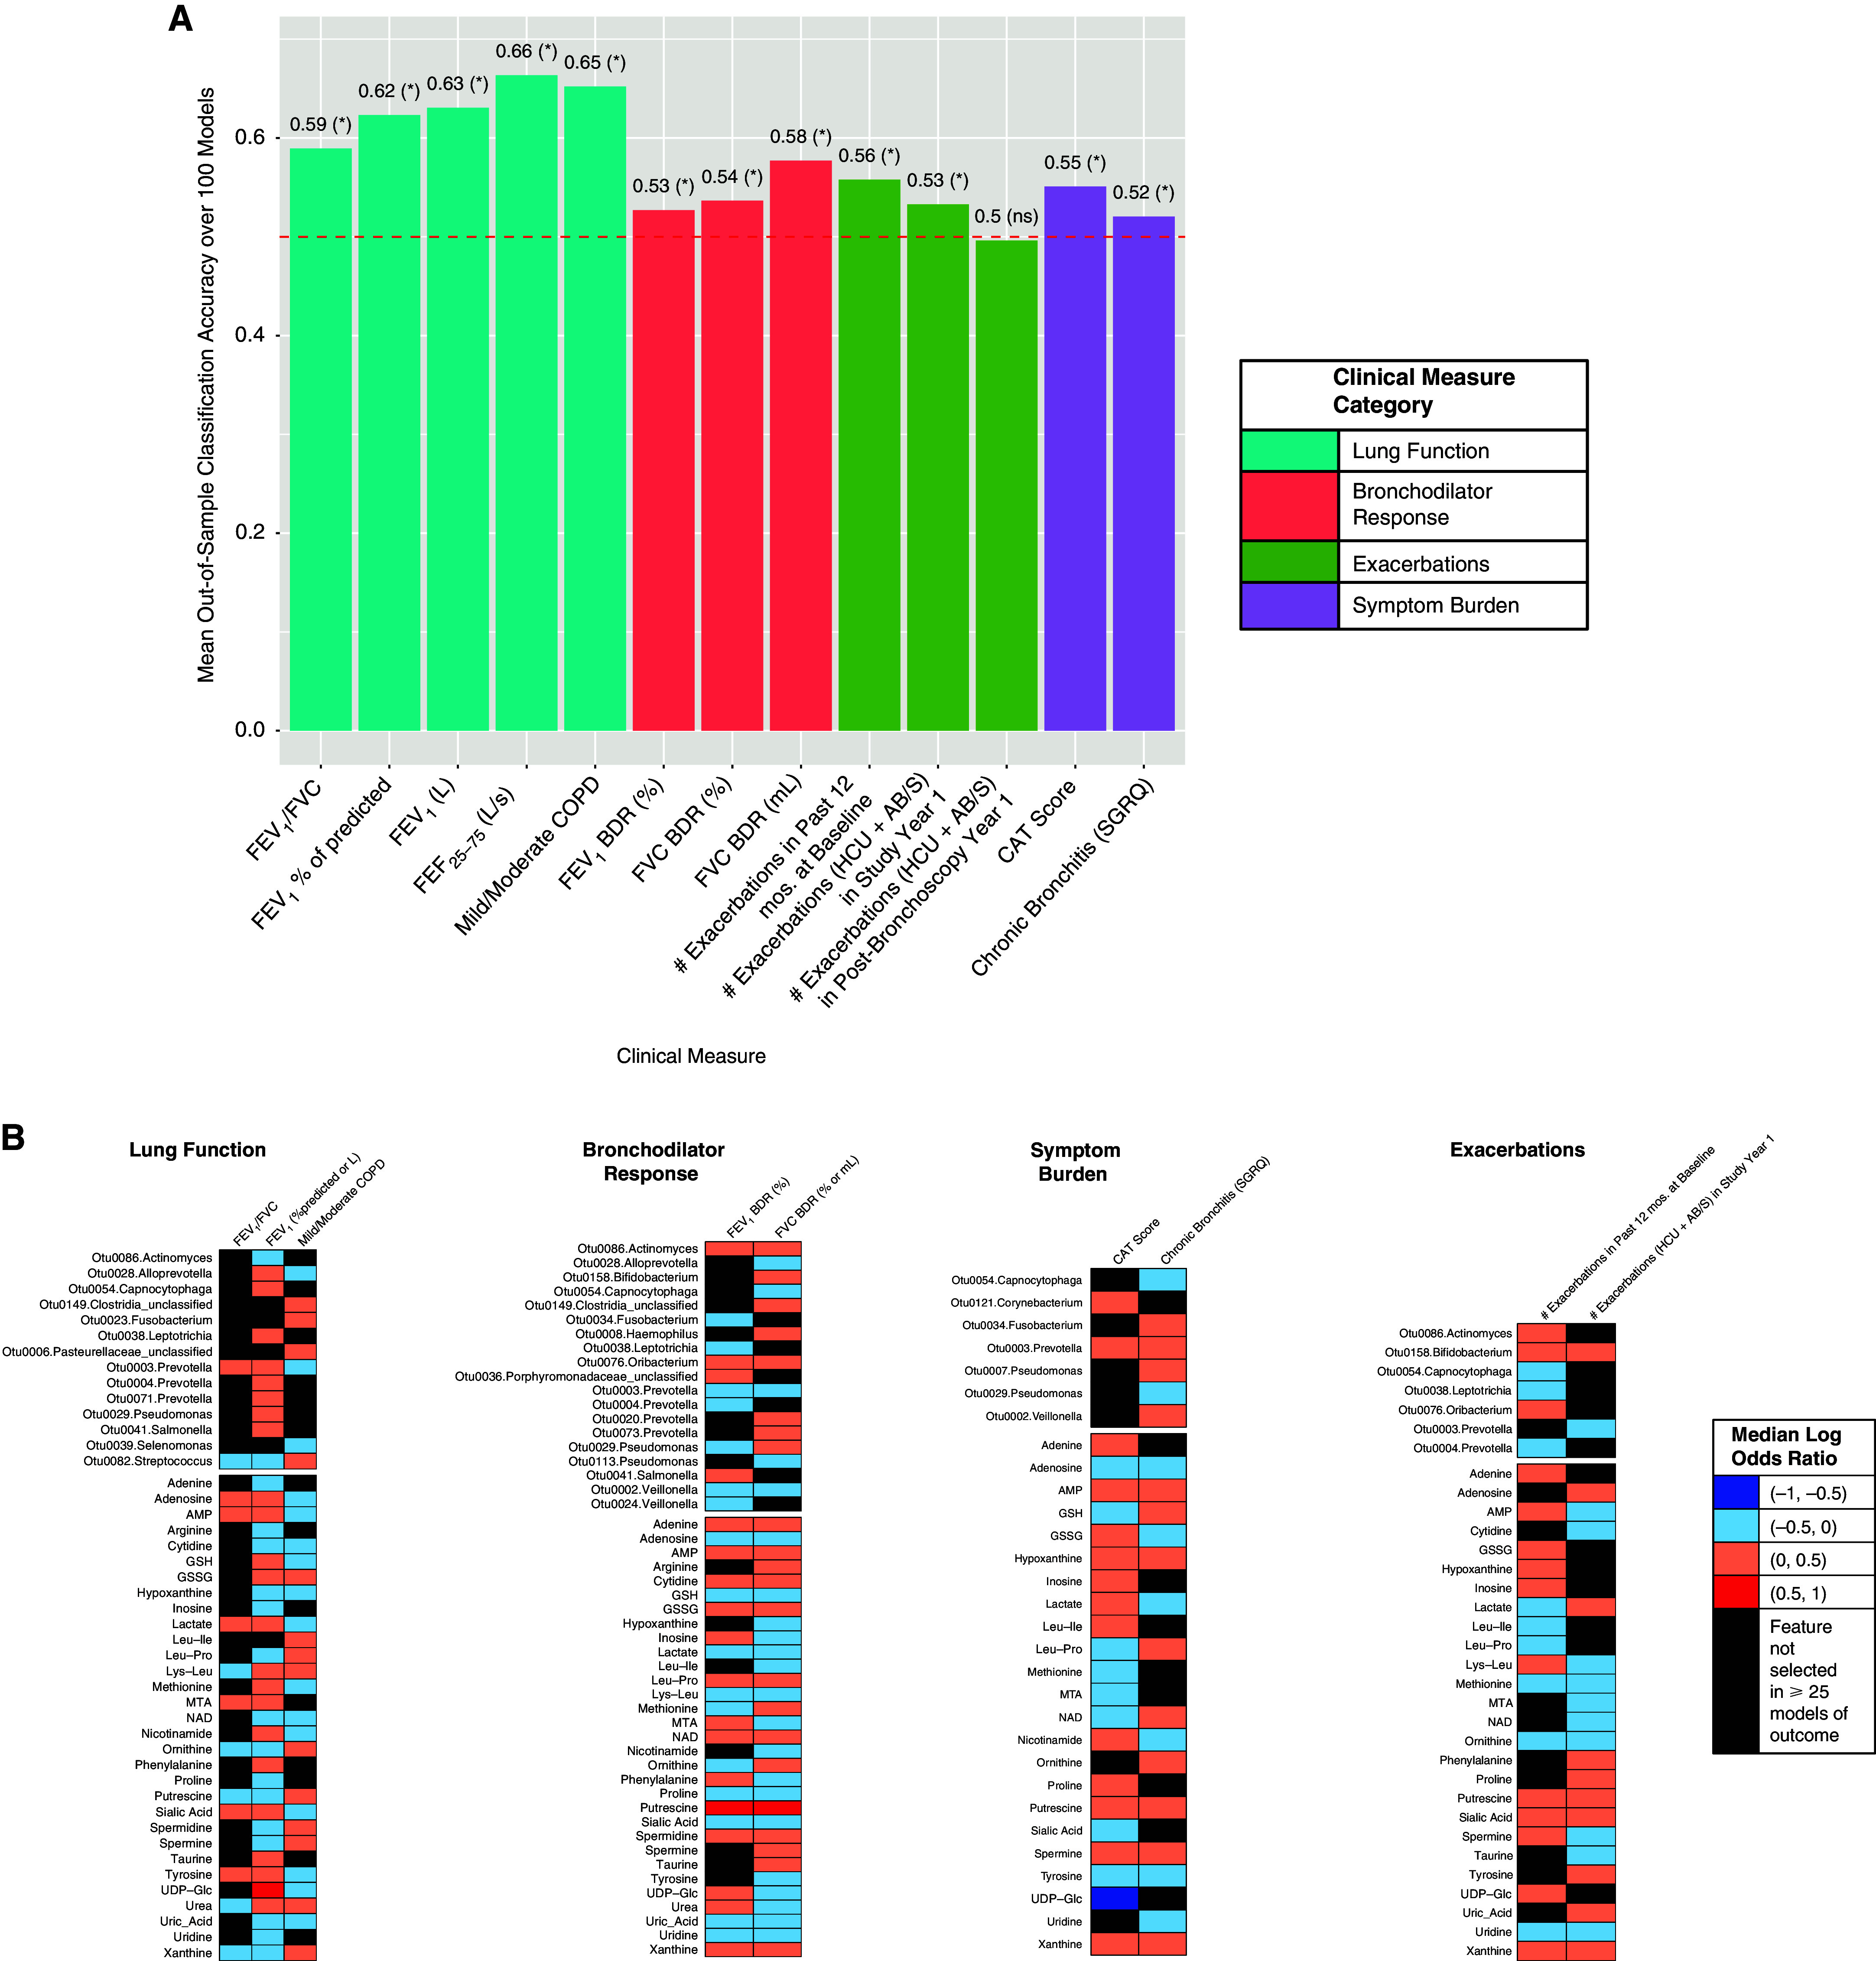
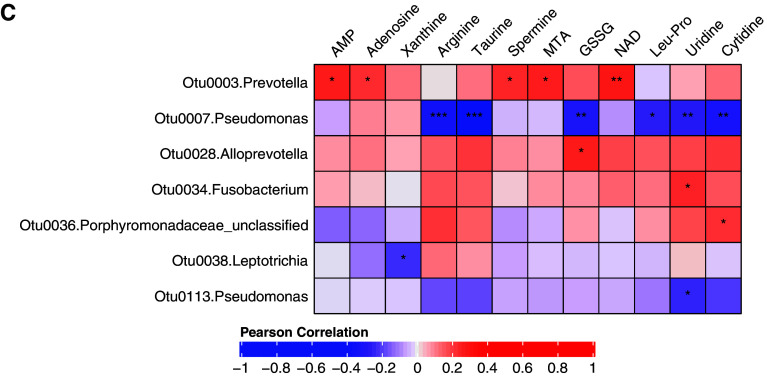
Figure 3.

Classification accuracies and the lung bacterial and metabolites from targeted metabolomics most strongly associated with each clinical outcome, as modeled in Framework 2. (A) Mean out-of-sample classification accuracies for each outcome. Asterisks indicate mean model performance > random chance (one-sided t test). (B) The most predictive features from adjusted elastic net models for outcomes whose classification accuracy exceeded random chance. (C) Correlation heatmap between lung microbiota and metabolites that were most strongly associated with the clinical measures. Only OTUs and metabolites having at least one significant correlation based on Padj < 0.05 (Benjamini–Hochberg correction) are shown. *0.01 ⩽ Padj < 0.05, **0.001 ⩽ Padj < 0.01, and ***Padj < 0.001. For definition of abbreviations, see Figure 1.

