Figure 4.

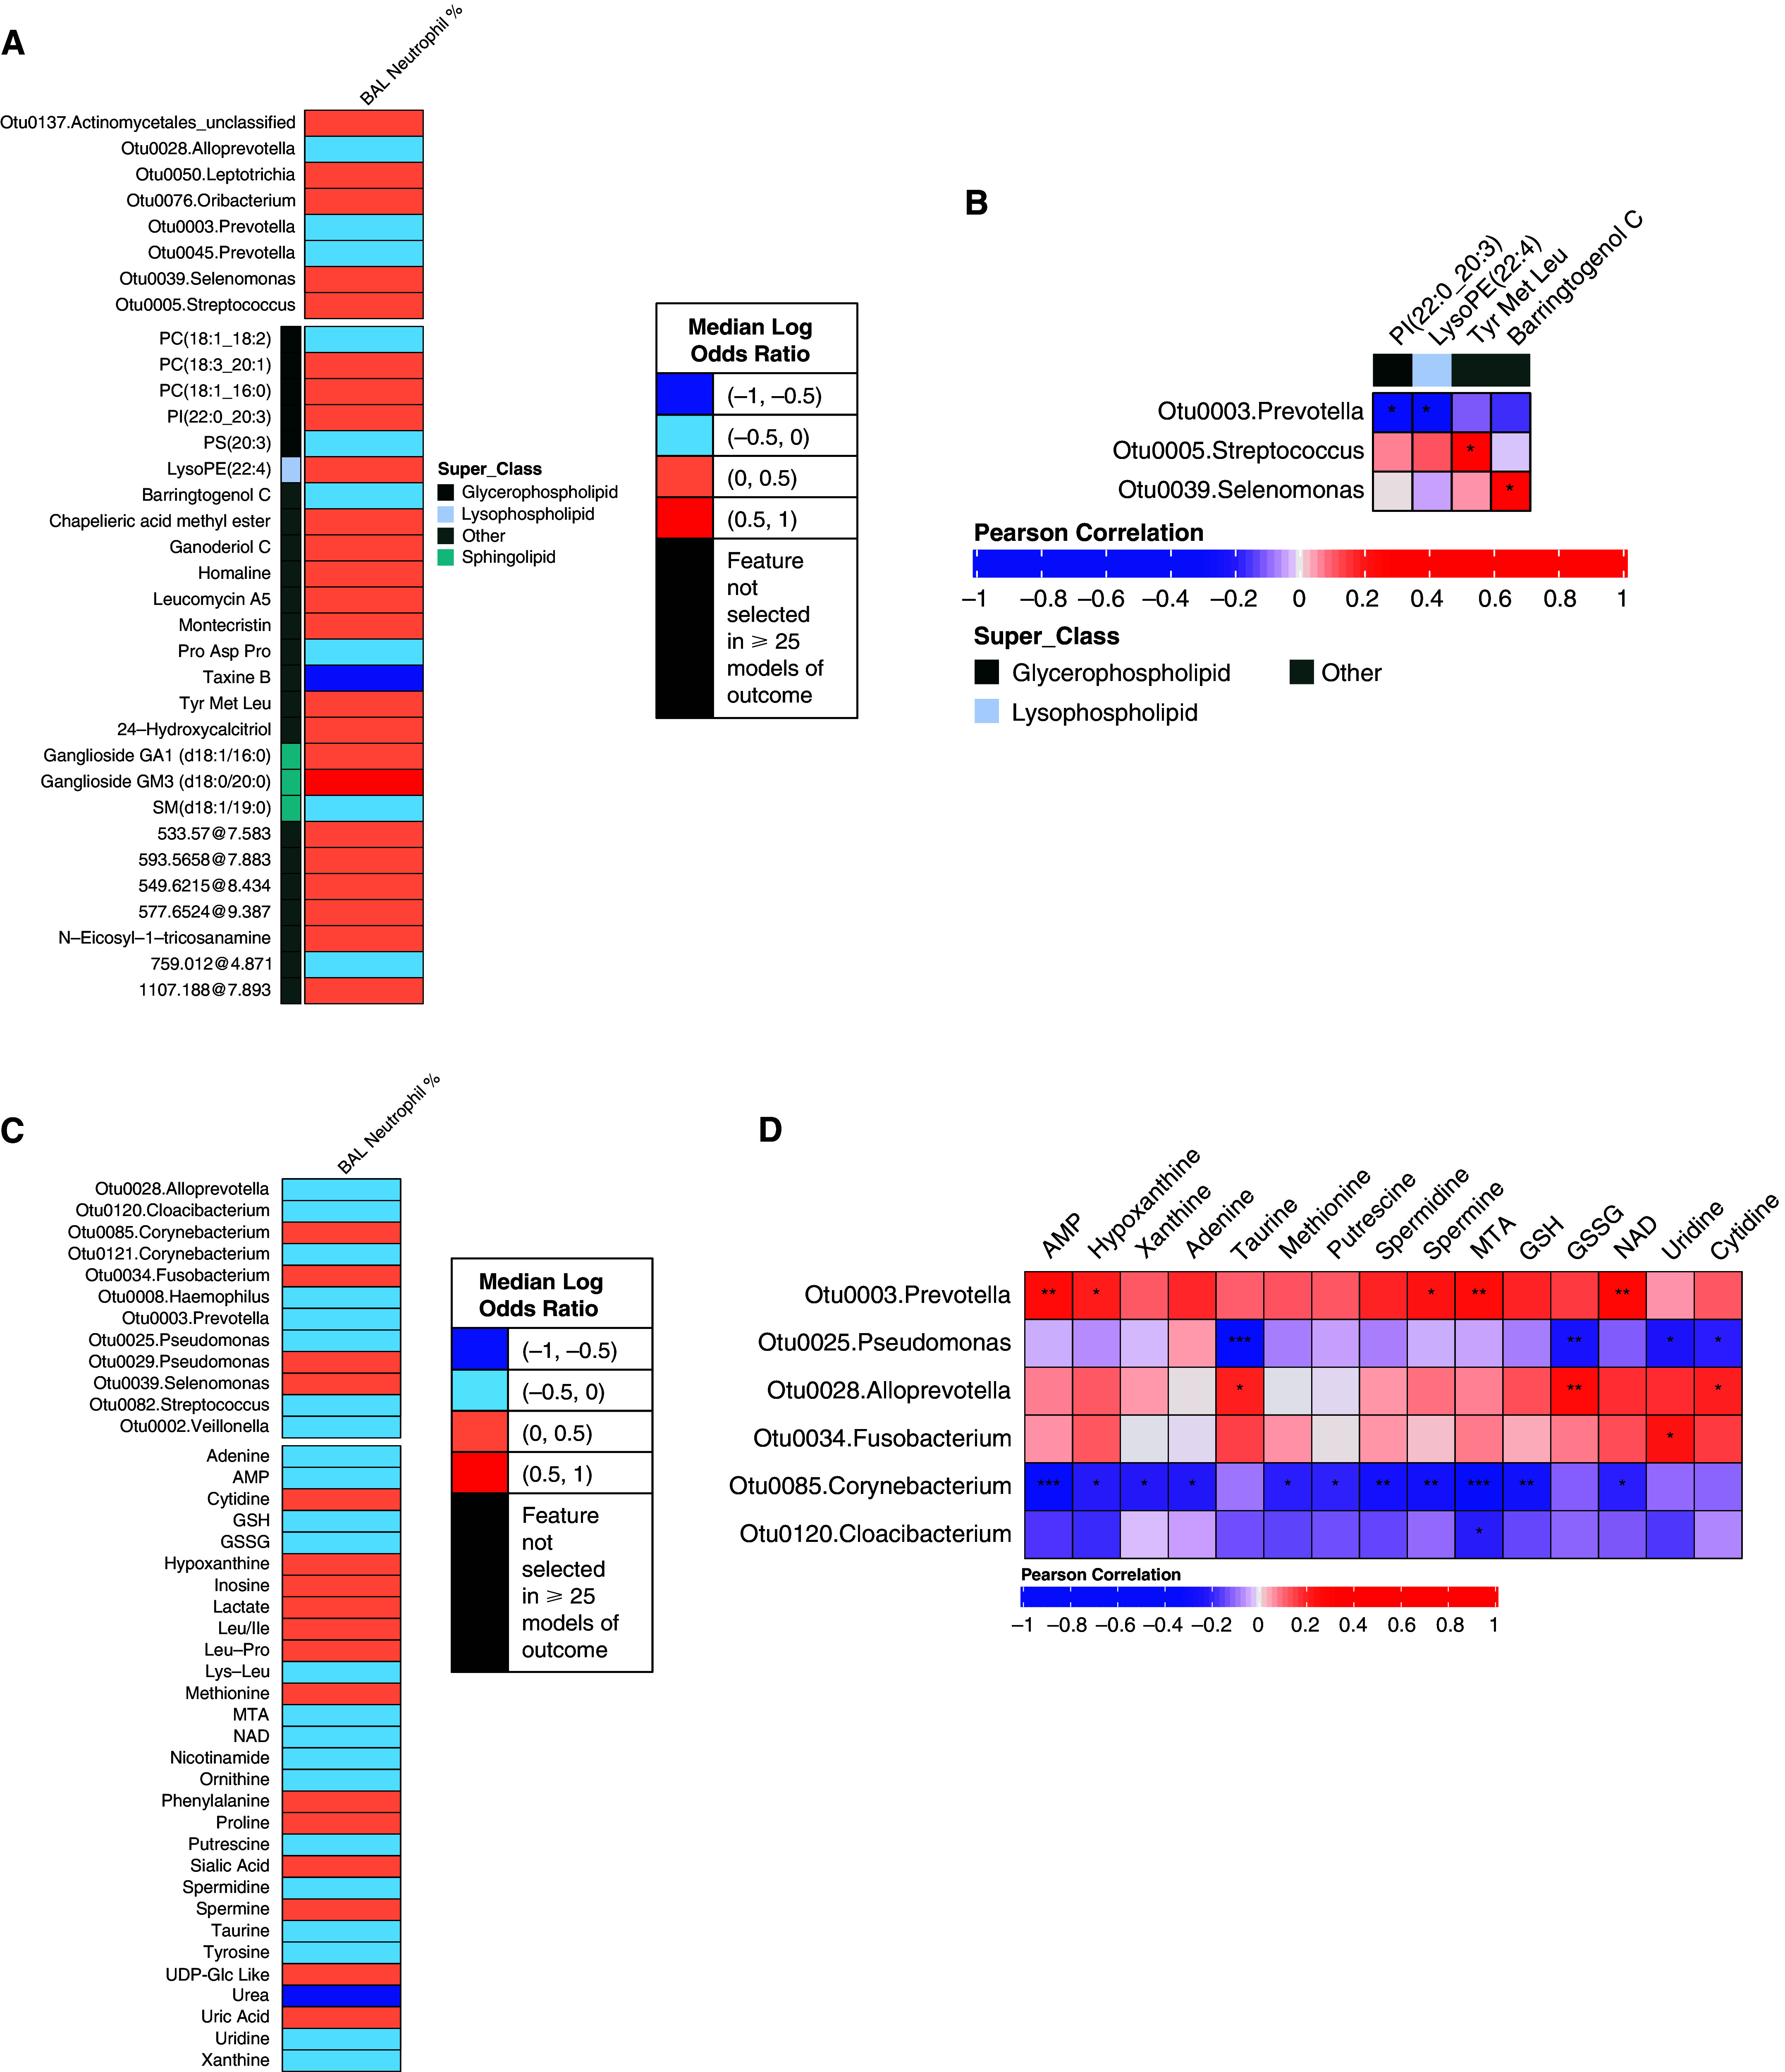
Bacterial and metabolite features associated with BAL neutrophil percentages and correlations between these features per Framework 1 (A and B) or Framework 2 (C and D). *0.01 ⩽ Padj < 0.05, **0.001 ⩽ Padj < 0.01, and ***Padj < 0.001.

Bacterial and metabolite features associated with BAL neutrophil percentages and correlations between these features per Framework 1 (A and B) or Framework 2 (C and D). *0.01 ⩽ Padj < 0.05, **0.001 ⩽ Padj < 0.01, and ***Padj < 0.001.