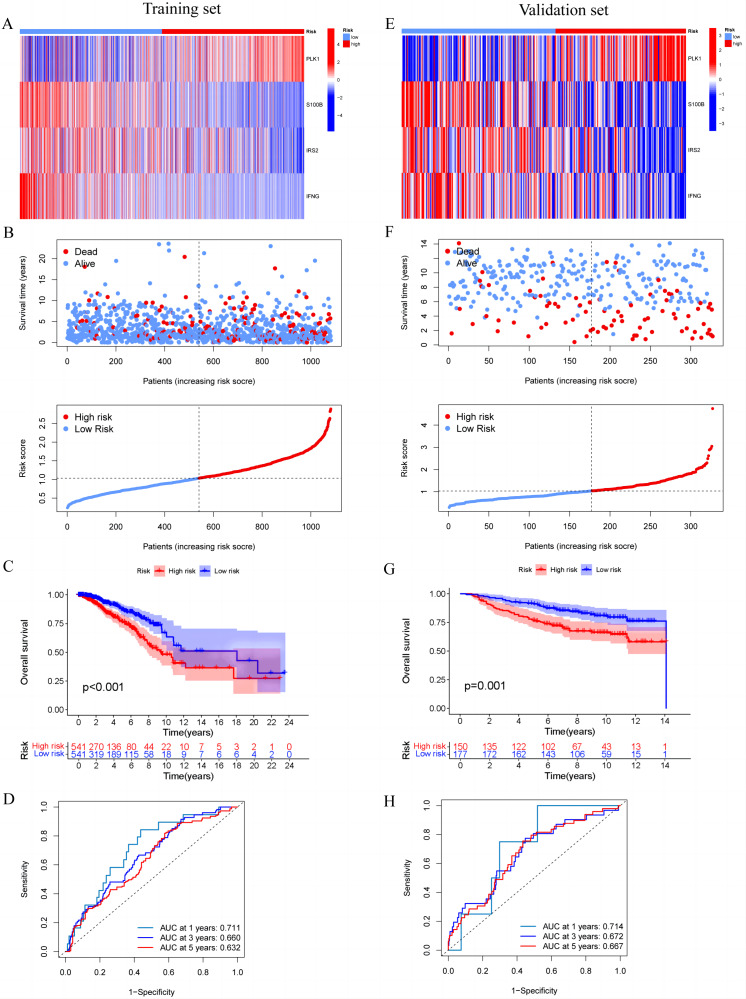
Figure 4. Construction and validation of prognostic risk profiles in breast cancer patients with four model genes.
(A and E) Heat map including four model genes in training set and validation set. (B and F) Risk plot distribution and survival status of patients in training set and validation set. (C and G) Kaplan–Meier survival curves of OS for patients between low-risk and high-risk groups in training set and validation set. (D and H) ROC curves for predictive performance of the risk model in training set and validation set.

