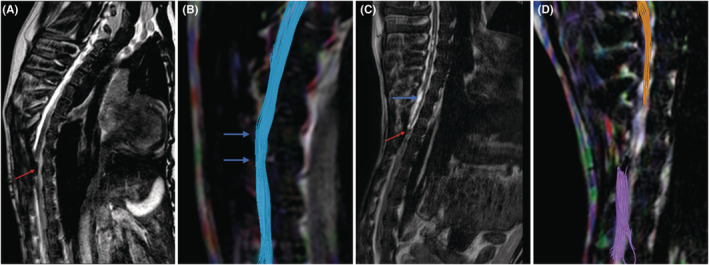
FIGURE 6.

T2WI and DTI analysis of experimental and control groups at 2 months post‐surgery. At the 2‐month mark post‐surgery, T2‐weighted imaging (T2WI) and Diffusion Tensor Imaging (DTI) were employed to assess the outcomes in both the experimental and control groups. In the experimental group, T2WI displayed a spinal cord graft with a relatively normal appearance and signal intensity, indicating successful reconstruction of spinal cord continuity (arrow in A). DTI in the experimental group revealed fusion and connection of nerve fibers at the two contact surfaces of the spinal cord graft and the recipient spinal cord (arrows in B). Conversely, T2WI in the control group revealed a smaller graft size, indicative of necrosis (red arrow in C), and cystic vacuolization in the nearby recipient spinal cord tissue (blue arrow in C). DTI in the control group demonstrated disruption of spinal cord continuity and the presence of large nerve fiber defects (D).
