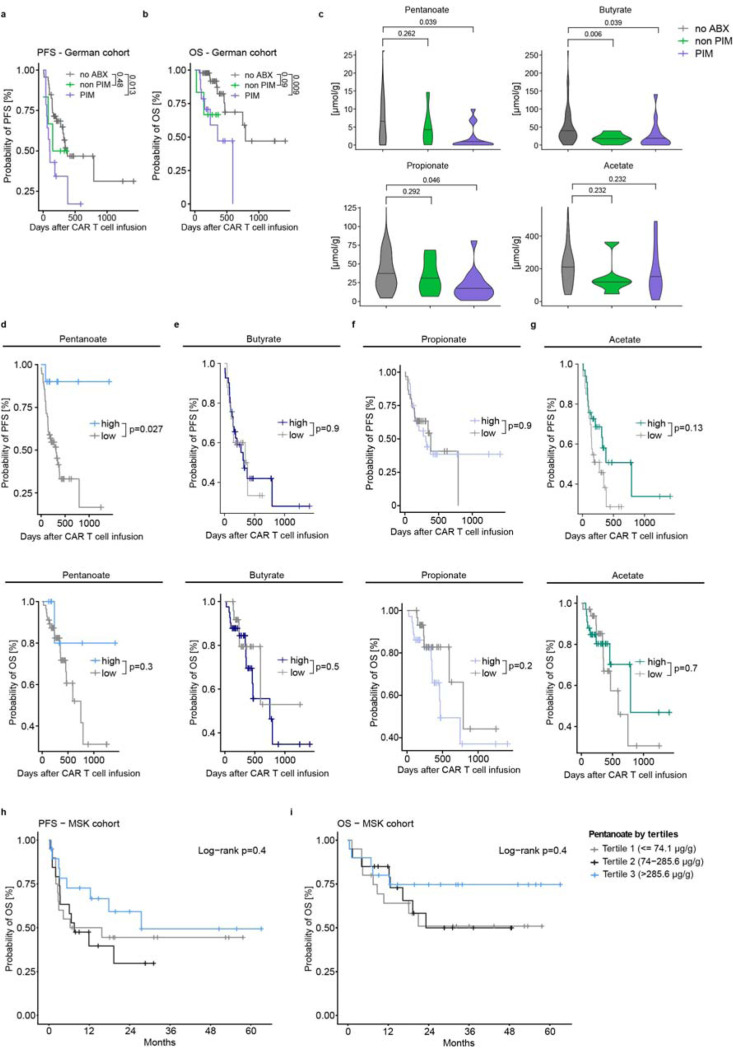
Figure 1: Pentanoate abundance is a predictor for clinical CAR T cell response.
a and b, Probability of progression-free survival (a) and overall survival (b) in a German cohort of patients receiving CAR T cells, depending on different antibiotic-(ABX)-treatment regimen. PIM (piperacillin/tazobactam, imipenem, meropenem); PFS, progression-free survival; OS, overall survival. c, Levels of multiple short-chain fatty acids following antibiotic exposure. d-g, Kaplan-Meier curves showing PFS (upper panel) and OS (lower panel) depending on the abundance of pentanoate (d), butyrate (e), propionate (f) and acetate (g). h,i Kaplan-Meier curves showing PFS (h) and OS (i) depending on the abundance of pentanoate in a US cohort.

