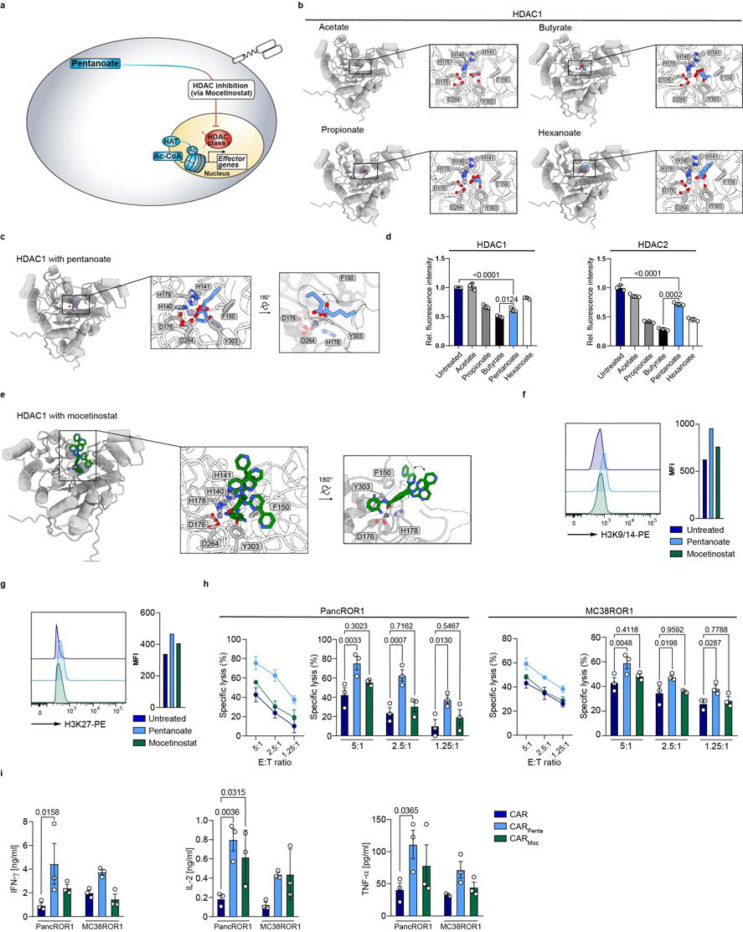
Figure 3: HDAC class I inhibition-mediated hyperacetylation enhances CAR T cell function.
a, Schematic pathway illustration detailing the HDAC-mediated T cell regulation. b and c, Shown are SCFAs (blue sticks), i.e. acetate, propionate, butyrate, pentanoate and hexanoate docked into AlphaFold 3-predicted models of zinc cofactor-bound (spheres) HDAC1 (gray cartoons). Three highest scoring conformations are shown superimposed for each ligand. d, Influence of bacterial SCFAs on the activity of recombinant class I and class II HDAC enzymes. e, Mocetinostat (green sticks, HDAC class I inhibitor) docked into an AlphaFold 3-predicted model of zinc cofactor-bound (spheres) HDAC1 (gray cartoons). Three highest scoring conformations are shown superimposed. f and g, Histone acetylation status of T cells are probed by the expression of H3K9/14 (f) and H3K27 (g) via flow cytometry after treatment with indicated substances. One representative experiment is shown (n = 3). h, Specific cytolytic activity of CD8+ CAR T cells generated in the presence of indicated substances against ROR1-expressing tumor cell lines at different E:T ratios after 6 h. Mean ± SEM from n = 3. i Cytokine secretion of CD8+ CAR T cells after 24 h co-culture with target antigen expressing cell lines, measured for IFN-γ, TNF-α and IL-2 by ELISA. Mean ± SEM from n = 3.
h and i, biological replicates; pooled data from independent experiments. Statistical analysis was performed using one-way ANOVA (h) or two-way ANOVA with Tukey’s multiple-comparison test (i).

