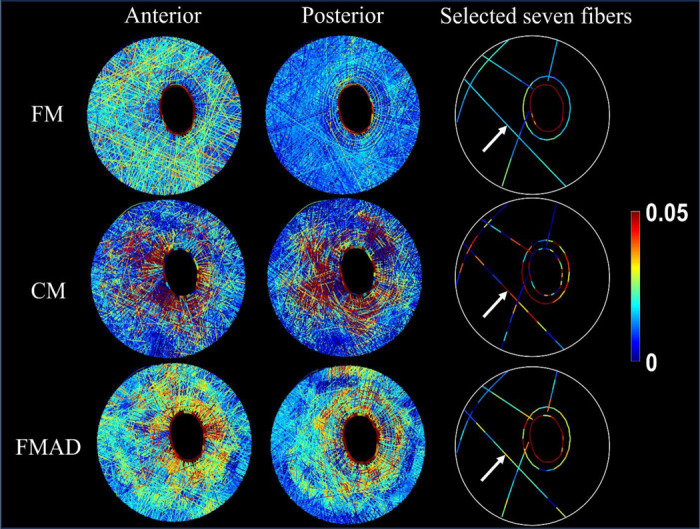
Figure 9.

Visualization of fiber strains for all sclera fibers (anterior view in the first column and posterior view in the second column) and seven selected whole fibers (third columns) in FM, CM, and FMAD. The selection of seven fibers allows for a clearer investigation of the fiber strain changes along each fiber. Further information on the fiber strain calculation methodologies for each model can be found in Figure 5 and Section 2.3.1. Take the fiber indicated by the arrows as an example. Note how the smooth strains along the fiber in the FM were disrupted in the CM and FMAD due to the enforcement of affine deformation in calculating the fiber strains. Interestingly, the fiber strains within the FM exhibit depth-dependent variation, with larger strains evident in the anterior view and smaller strains in the posterior view. This variation appears to be less pronounced or absent in the CM and FMAD models.
