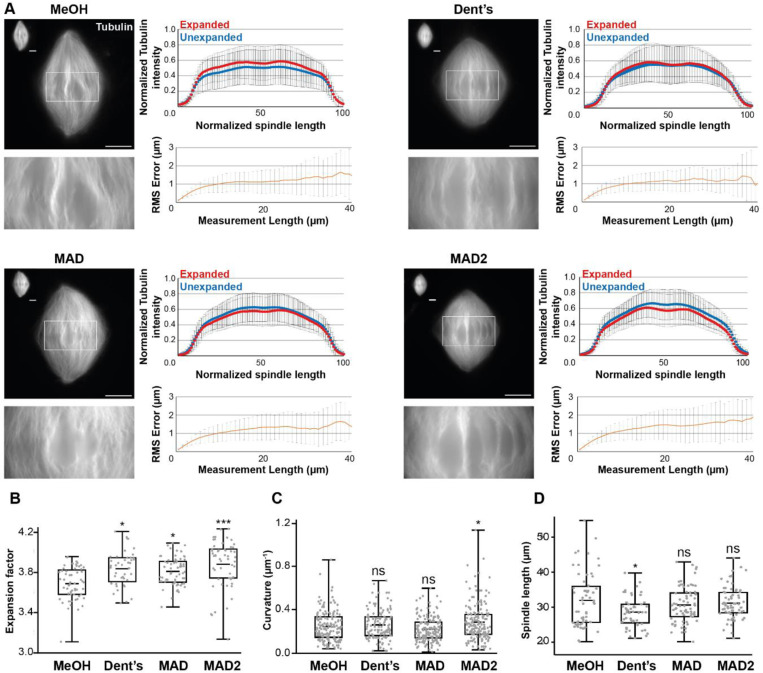
FIGURE 4:
Evaluating the effects of changing the nature of the post-centrifugation fixation. (A) The four tested conditions differing by the composition of the post-centrifugation fixation: MeOH (100% methanol), Dent’s (80% methanol, 20% DMSO), MAD (40% methanol, 40% acetone, 20% DMSO), MAD2 (60% methanol, 20% acetone, 20% DMSO). For each top left images show expanded spindles (rhodamine-labeled tubulin signal) and their corresponding unexpanded spindles in the top left corner of the image. Bottom left images are magnified views of boxed regions in top images. Top right panels are the average normalized fluorescence intensity distributions ± standard deviation for unexpanded (blue) and expanded (red) (n= 57 spindles from 6 egg extracts, n = 47 spindles from 5 egg extracts, n= 64 from 5 egg extracts, n = 60 spindles from 6 egg extracts, respectively for MeOH, Dent’s, MAD and MAD2). Bottom right panels represent the Root-Mean-Square length measurement error as a function of measurement length for pre- vs. post-expansion images. The orange line shows the average and the error bars, the standard deviation (n = 56 spindles from 6 egg extracts, n = 44 spindles from 5 egg extracts, n = 64 spindles from 5 egg extracts, n = 54 spindles from 6 egg extracts, respectively for MeOH, Dent’s, MAD and MAD2). (B) Boxplots showing individual spindle expansion factors (same statistics as for Root-Mean-Square error study), the center line is the mean, the box indicates the 25%−75% quantiles and the error bars the minimum and maximum values. Average expansion factors were MeOH: 3.68 ± 0.16, Dent’s: 3.83 ± 0.17, MAD: 3.80 ± 0.14, MAD2: 3.88 ± 0.23 (average value ± standard deviation). (C) Boxplots showing average curvature of microtubules measured by tracking individual microtubule bundles on expanded spindles (n = 159 microtubules, n = 122 microtubules, n = 173 microtubules, n = 168 microtubules, respectively for MeOH, Dent’s, MAD and MAD2), the center line is the mean, the box indicates the 25%−75% quantiles and the error bars the minimum and maximum values. Average curvature were MeOH: 0.25 μm−1 ± 0.14, Dent’s: 0.27 μm−1 ± 0.13, MAD: 0.23 μm−1 ± 0.11, MAD: 0.29 μm−1 ± 0.17 (average value ± standard deviation). (D) Boxplots showing individual spindle length measured on unexpanded spindles (n = 59 spindles from 6 egg extracts, n = 52 spindles from 5 egg extracts, n = 61 spindles from 5 egg extracts, n = 61 spindles from 6 egg extracts, respectively for MeOH, Dent’s, MAD and MAD2), the center line is the mean, the box indicates the 25%−75% quantiles and the error bars the minimum and maximum values. Average spindle length were MeOH: 31.93 μm ± 7.72, Dent’s: 28.57 μm ± 4.26, MAD: 30.62 μm ± 4.99, MAD2: 31.12 μm ± 4.53 (average value ± standard deviation). Scale bars, 10 μm for unexpanded spindles and 40 μm for expanded spindles. * p < 0.05, ** p < 0.01, *** p < 0.001, ns non-significant.

