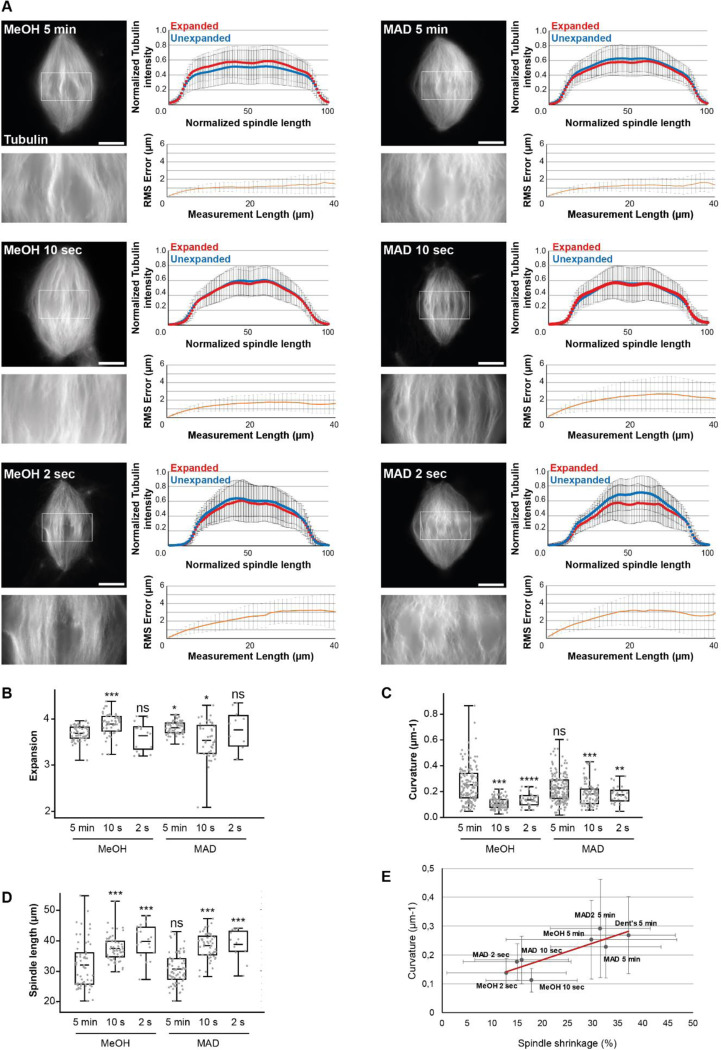
FIGURE 5:
Evaluating the effects of decreasing the duration of the post-centrifugation fixation. (A) The six tested conditions differing by the composition and duration of the post-centrifugation fixation: MeOH (100% methanol, left), MAD (40% methanol, 40% acetone, 20% DMSO, right), the durations are indicated on each spindle image. Each top left images show expanded spindles (rhodamine-labeled tubulin signal). Corresponding bottom left images are magnified views of boxed regions in top images. Top right panels are the average normalized fluorescence intensity of tubulin distributions ± standard deviation for unexpanded (blue) and expanded (red) (n= 57 spindles from 6 egg extracts, n = 51 spindles from 4 egg extracts, n=17 from two egg extracts, n = 64 spindles from 5 egg extracts, n= 45 spindles from 4 egg extracts, n = 11 spindles from two egg extracts respectively for MeOH 5 min, MeOH 10 s, MeOH 2 s, MAD 5 min, MAD 10 s and MAD 2 s). Bottom right panels represent the Root-Mean-Square length measurement error as a function of measurement length for pre- vs. post-expansion images. The orange line shows the average and the error bars, the standard deviation (n= 56 spindles from 6 egg extracts, n = 52 spindles from 4 egg extracts, n= 16 spindles from two egg extracts, n = 64 spindles from 5 egg extracts, n= 44 from 4 egg extracts, n = 11 spindles from two egg extracts respectively for MeOH 5 min, MeOH 10 s, MeOH 2 s, MAD 5 min, MAD 10 s and MAD 2 s). (B) Boxplots showing individual spindle expansion factors (same statistics as for Root-Mean-Square error study), the center line is the mean, the box indicates the 25%−75% quantiles and the error bars the minimum and maximum values. Average expansion factors were MeOH 5 min: 3.68 ± 0.16, MeOH 10 s: 3.88 ± 0.23, MeOH 2 s: 3.63 ± 0.30, MAD 5 min: 3.80 ± 0.14, MAD 10 s: 3,53 ± 0,39, MAD 2 s: 3,76 ± 0,43 (average value ± standard deviation). (C) Boxplots showing average curvature of microtubules measured by tracking individual microtubule bundles on expanded spindles (n = 159 microtubules, n = 112 microtubules, n = 34 microtubules, n = 173 microtubules, n = 90 microtubules, n = 30 respectively for MeOH 5 min, MeOH 10 s, MeOH 2 s, MAD 5 min, MAD 10 s and MAD 2 s), the center line is the mean, the box indicates the 25%−75% quantiles and the error bars the minimum and maximum values. Average curvature were MeOH 5 min: 0.25 μm−1 ± 0.14, MeOH 10 s: 0.11 μm−1 ± 0.04, MeOH 2 s: 0.14 μm−1 ± 0.05, MAD 5 min: 0.23 μm−1 ± 0.11, MAD 10 s: 0.18 μm−1 ± 0.08, MAD 2 s: 0.18 μm-1 ± 0.06 (average value ± standard deviation). (D) Boxplots showing individual spindle length measured on unexpanded spindles (n= 56 spindles from 6 egg extracts, n = 58 spindles from 4 egg extracts, n= 18 from two egg extracts, n = 72 spindles from 5 egg extracts, n= 50 spindles from 4 egg extracts, n = 12 spindles from two egg extracts respectively for MeOH 5 min, MeOH 10 s, MeOH 2 s, MAD 5 min, MAD 10 s and MAD 2 s), the center line is the mean, the box indicates the 25%−75% quantiles and the error bars the minimum and maximum values. Average spindle length were MeOH 5 min: 31.93 μm ± 7.72, MeOH 10 s: 37.35 μm ± 4.14, MeOH 2 s: 39.63 μm ± 5.39, MAD 5 min: 30.62 μm ± 5.00, MAD 10 s: 38.24 ± 4.25, MAD 2 s: 38.65 ± 4.88 (average value ± standard deviation). (E) Representation of average curvature of microtubules as a function of spindle shrinkage. Black dots, values for indicated conditions, red line, linear trend curve (R2 = 0.74). Scale bars, 40 μm. * p < 0.05, ** p < 0.01, *** p < 0.001, ns non-significant.

