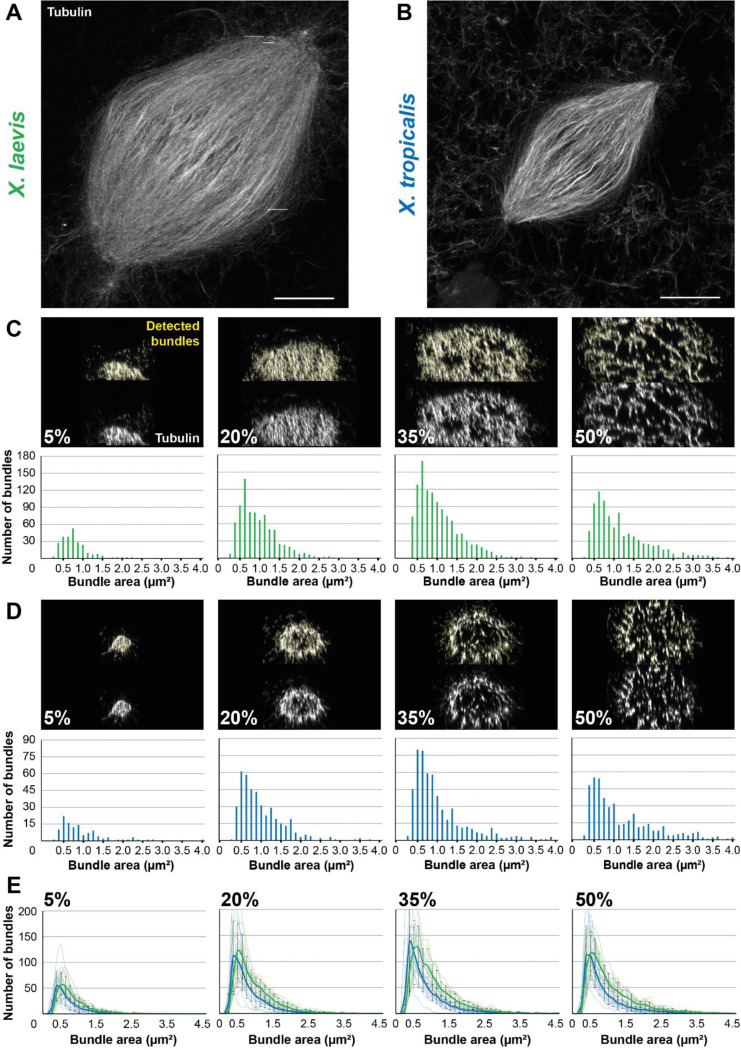
FIGURE 6:
Development of an analysis workflow to analyze and compare expanded spindles from X. laevis and X. tropicalis. (A) Expanded spindle from X. laevis egg extract with rhodamine-labeled tubulin signal, imaged with Airyscan microscope, image taken from a 3 dimensional rendering in Napari. (B) Expanded spindle from X. tropicalis egg extract with rhodamine-labeled tubulin signal, imaged with Airyscan microscope, image taken from a 3 dimensions rendering in Napari. (C) Top images show cross-sectioned microtubule bundles from the spindle in (A) (respective sections are indicated in bottom left corners) before (bottom) and after (top) bundle detection (in yellow) by the ImageJ macro. Bottom bar plots show the distribution of these detected bundles, according to their area. (D) Top images show cross-sectioned microtubule bundles from the spindle in (B) (respective sections are indicated in bottom left corners) before (bottom) and after (top) bundle detection (in yellow) by the Fiji macro. Bottom bar plots show the distribution of these detected bundles according to their area. (E) Distribution of the average number of bundles according to their area ± standard deviation for spindles from X. laevis (green, n = 11 spindles from three egg extracts) and X. tropicalis (blue, n = 15 spindles from three egg extracts) in indicated cross-sections. For (C-E) bundle areas are binned into classes of 0.125 μm2. Each bin is named according to its upper range value. Scale bars, 20 μm.

