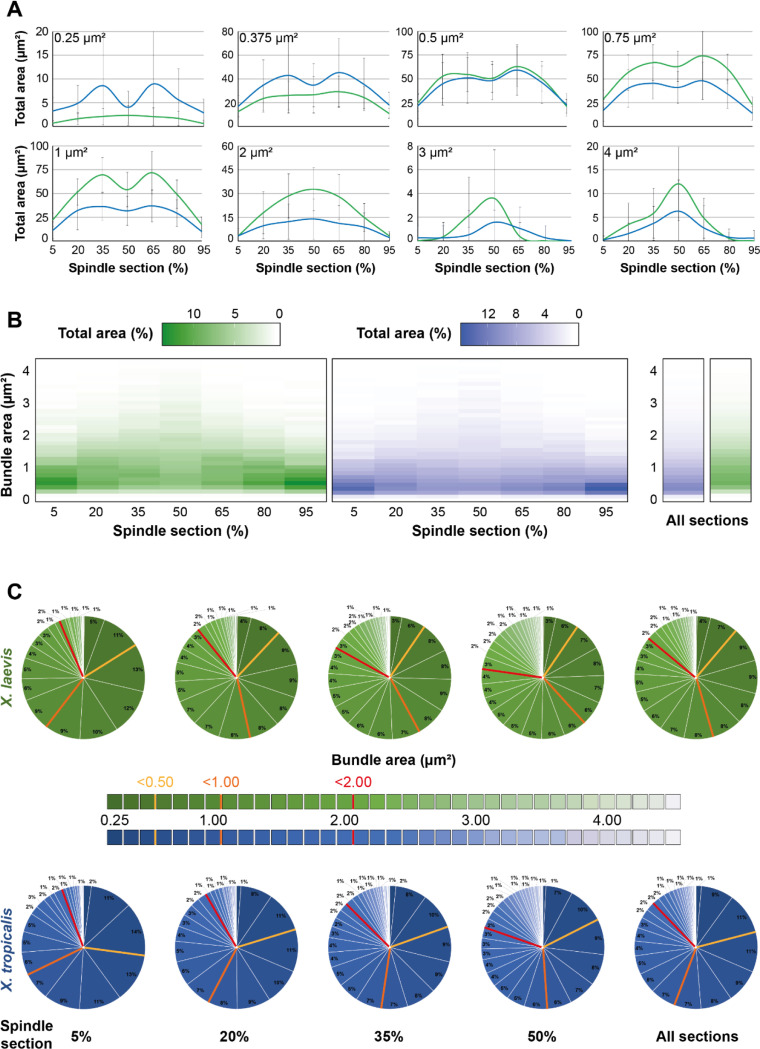
FIGURE 7:
Analysis of the organizational differences between spindles from X. laevis and X. tropicalis. (A) Normalized average total area of indicated bundle area size bins (top left corners) according to the spindle cross-sections from X. laevis (green) and X. tropicalis (blue). Note that the absence of left-right symmetry for the distributions of large bundles (3 and 4 μm2) is the results of their low count (See Figure 6). (B) Heatmaps representing for each bundle area size bin (y-axis) its normalized average total area (color intensity) for the different indicated cross-sections of the spindle (x-axis) (left) or for all sections together (right) from X. laevis (green) and X. tropicalis (blue). (C) Pie charts of normalized average total area of bundles according to their binned areas for the different indicated cross-sections of the spindle or for all sections together (right pie charts) from X. laevis (green) and X. tropicalis (blue). Colored bars in pie charts delimit areas of greater classes of bundle areas (bin 0.0 – 0.5 μm2, yellow; bin 0.625 – 1.0 μm2, orange; bin 1.125 – 2.0 μm2, red). For (A-C), bundle areas are binned into classes of 0.125 μm2. Each bin is named according to its upper range value; n = 11 spindles from three egg extracts, n = 15 spindles from three egg extracts, respectively for X. laevis and X. tropicalis.

