Figure 6.
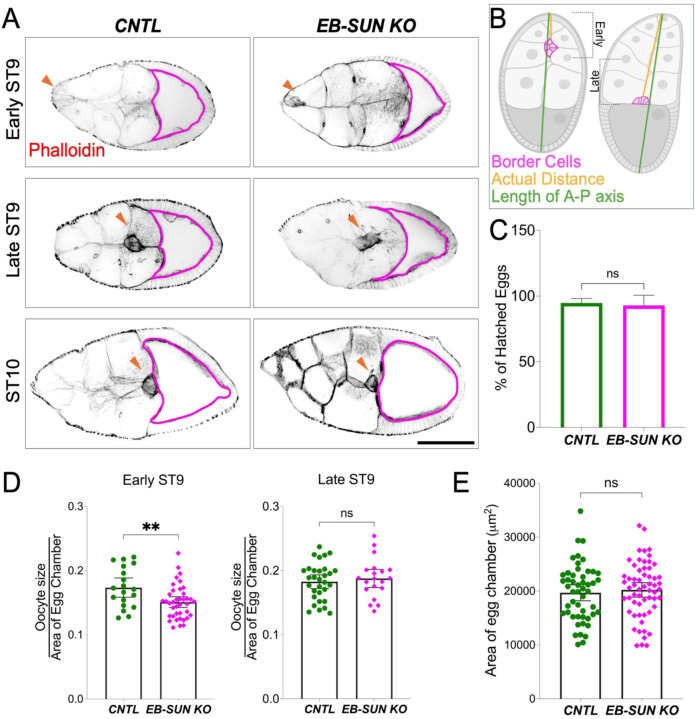
Oocyte growth is delayed in EB-SUN KO during late mid-oogenesis. A) In early ST9, the size of homozygous EB-SUN KO oocytes is smaller than that of controls. However, by late ST9, oocytes in the EB-SUN KO catch up to a size similar to that of controls. Scale bar: 100 μm. (B) Schematic illustrating how early and late stages were defined based on border cell migration. (C) Hatching rate of homozygous EB-SUN KO fly lines. The hatching assay was performed by counting the number of hatched eggs 24 hours after laying. Data are represented as the mean with 95% CI. N = 420 for control; N = 378 for EB-SUN KO from 12 independent collections. Two-tailed unpaired t-tests were performed. (D) The fraction of oocyte size relative to the total area of the egg chamber was measured in early and late ST9. Oocytes in EB-SUN KO are significantly smaller than those in controls at early ST9, but there is no difference at late ST9 (p=0.0053 for early ST9, p=0.561 for late ST9). For controls: N = 19 (early ST9), N = 31 (late ST9); For EB-SUN KO: N = 39 (early ST9), N = 20 (late ST9). (E) Quantification of the egg chamber area at ST9 in both control and EB-SUN KO shows no significant difference. N = 50 for control; N = 59 for EB-SUN KO. Error bars represent 95% CI. Two-tailed unpaired t-tests were performed.

