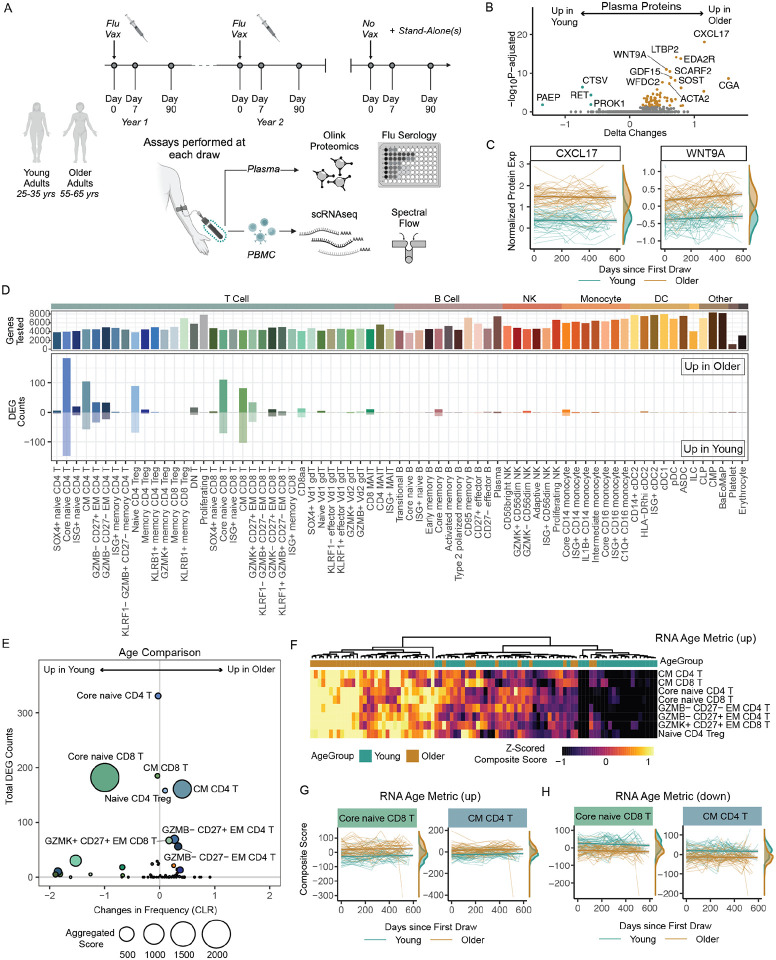
Figure 2. Maintenance of age-related alterations in the healthy human immune landscape over time.
A. Overview of the longitudinal Sound Life cohort of healthy young (n=49) and older (n=47) adults. B. Volcano plot of the age-related protein expression differences in circulating plasma proteome at baseline (Flu Vax Year 1 Day 0). C. CXCL17 and WNT9A normalized protein expression (NPX) over time in young (teal) and older (bronze) adult plasma. Each donors’ samples are connected by a line. D. The number of differential expressed genes (DEGs) from DEseq2 analysis (log2fc >0.1 and p.adj<0.05) of immune cells subsets from young and older adults at ‘Flu Vax Year 1 Day 0’. E. Bubble plot comparison of the change in frequency (using centered log-ratio (CLR) transformation) and number of DEGs at ‘Flu Vax year 1 day 0’ between young and older adults. Bubble size shows a combined metric of change defined as -log10(p.adj from CLR freq comparison) x DEG_Counts. P.adj for CLR freq was determined using Wilcoxon rank-sum test with Benjamini–Hochberg correction. F. The RNA age metric, calculated as a composite score of the top upregulated DEGs for each subset with >20 DEGs, shown across each donor at Flu Vax Year 1 Day 0. G. RNA age metric (upregulated genes) in select subsets over time in young and older adults. Each donors’ samples are connected with a thin line. H. RNA age metric (downregulated genes) in select subsets over time in young and older adults. Each donors’ samples are connected with a thin line.

