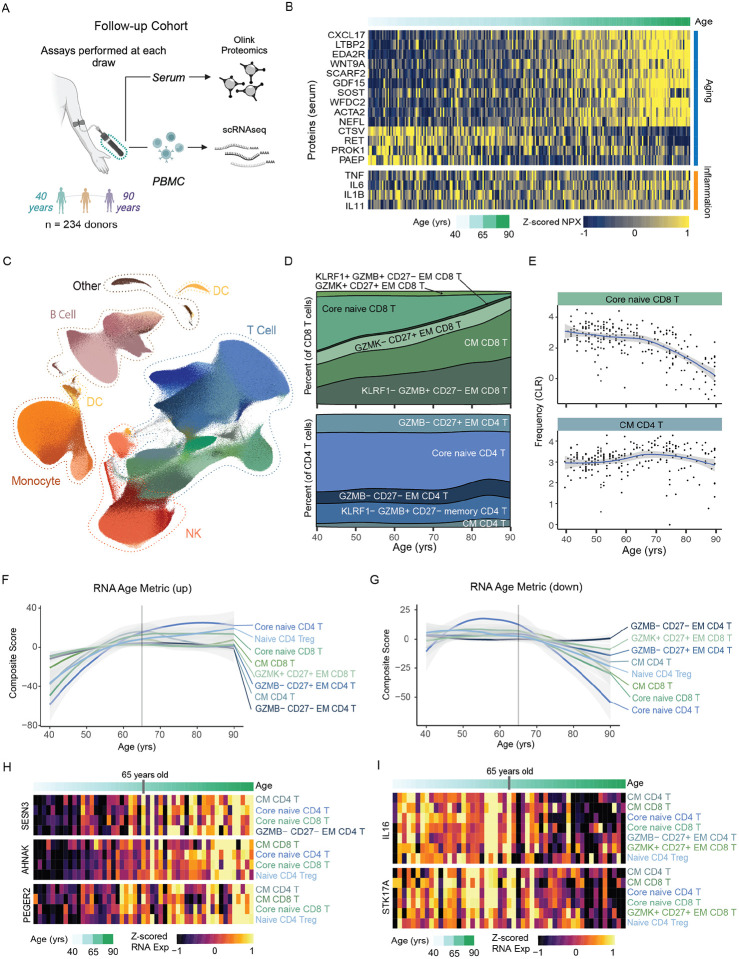
Figure 3. Dynamics of the healthy human immune landscape across age.
A. Overview of our follow-up cohort of healthy adults (n=234) ranging from 40 – 90 years of age. B. Normalized protein expression (NPX) of select age- and inflammation-related serum proteins in our follow-up cohort, with donors ordered by age. C. UMAP of scRNAseq data generated from our follow-up cohort, totaling a final reference dataset of 3.2 million PBMCs. C. Distribution of immune cells by sex and CMV infection status with the UMAP. D. Composition of CD8 and CD4 T cell compartment across age. E. Frequencies (using centered log-ratio (CLR) transformation) of select T cell subsets within PBMCs across age. Regression line shown with 95% confidence intervals in gray. F. The average RNA Age Metric (upregulated genes) for the top age-impacted immune cell subset, shown across age. Regression line shown with 95% confidence intervals in gray. G. The average RNA Age Metric (downregulated genes) for the top age-impacted immune cell subset, shown across age. Regression line shown with 95% confidence intervals in gray. H-I. Heatmap of mean RNA expression by age in the follow-up cohort for select H. up-regulated and I. down-regulated genes identified from initial DEG analysis.

