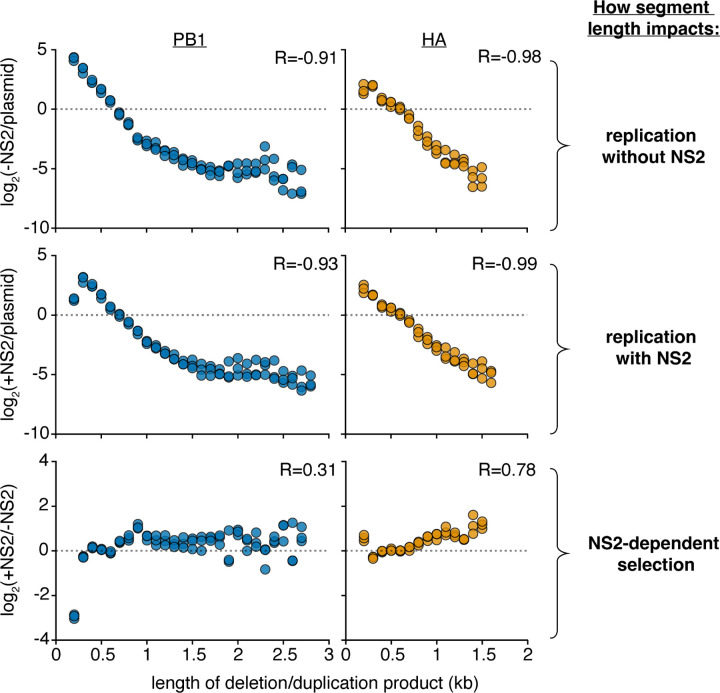
Figure 3. Analysis of length variant libraries confirms NS2-dependent replication effects.
Size distributions of libraries in transfections with minimal replication machinery only (-NS2) and with the addition of NS2 (+NS2) 24 hours post-transfection in HEK293T cells as compared to the original plasmid library or one-another. The fraction of variants falling within each 100nt bin was compared. Points above the dotted line represent sizes in each individual library which were enriched, below, depleted. Points were only shown if represented in all three libraries under both conditions. R is the Spearman correlation coefficient. n = 3, all replicates shown. Inter-replicate correlation plots presented in Supplementary Fig. 2.

