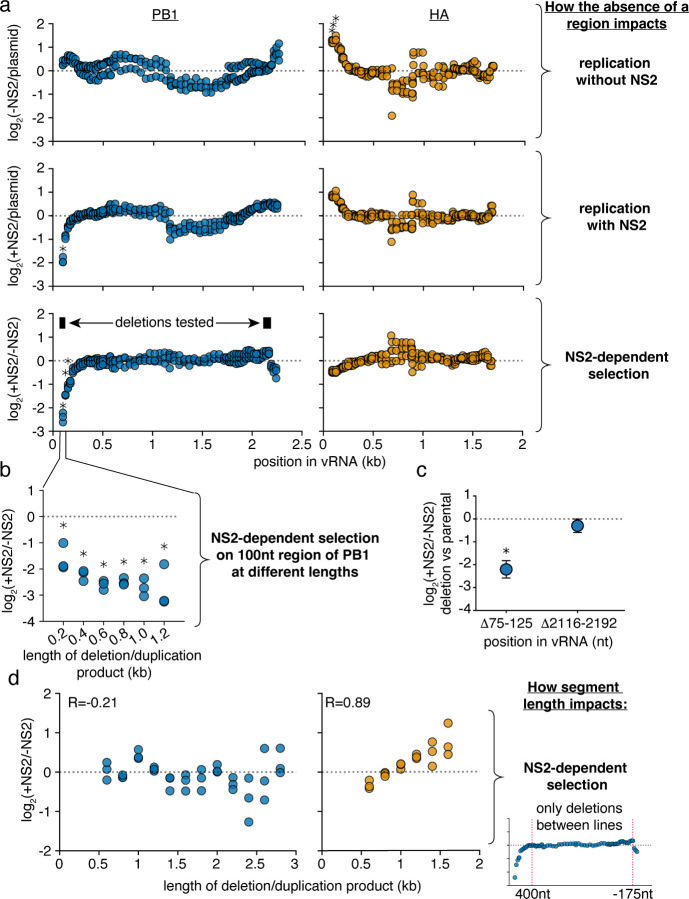
Figure 4. Specific regions in PB1 influence replication in the presence of NS2.
a Reanalysis of data from Fig. 3. The abundance of each variant that does, or does not, encode the indicated region was measured. Then, comparing only variants of identical length, the frequency at which a region is, or is not, observed under each condition was determined. Again, within only variants of identical size, changes in this frequency were measured, and the final value, presented in this graph, represents the median measurement across all lengths within a given replicate. Points above the dotted line indicate individual regions whose absence enhances replication under each indicated comparison, while points below indicate regions whose absence is associated with decreased replication. Asterisks indicate regions with a greater-than 2-fold effect size that differ significantly from no effect, one-sample two-tailed t-test, Benjamini-Hochberg corrected FDR<0.1. b The ratio of replication of sequences containing or not containing a region centering at the 100nt position, with, and without NS2 expression, across a range of lengths. Points are only shown if there were at least 100 measurements across all conditions. Statistics performed as in (a), with a stricter FDR cutoff of 0.05. c Each indicated deletion was generated in a PB1177:385 background, co-transfected with a barcoded PB1 400nt internal control with, or without, NS2, and its replication was compared against the parental background at 24h post-transfection by qPCR. Asterisks indicate a ratio significantly less than 1, one-tailed one-sample t-test, p<0.05, indicating that the a given deletion reduces replication efficiency when NS2 is expressed. Points represent mean and standard deviation, n=3. d Library data analyzed as in Fig 3, bottom, excluding deletions that remove the indicated regions (first 400nt and last 175nt) in PB1 or HA.

