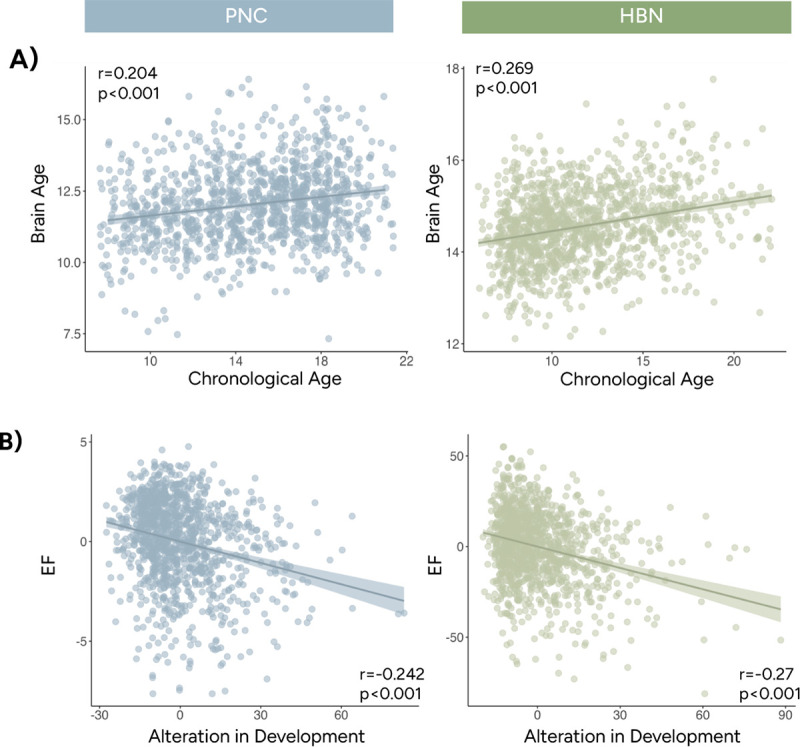
Figure 6.

Age predictions using state engagement variability measures. A) Brain age predicted by state engagement variabilities was significantly associated with chronological age. B) Individuals with state engagement variabilities resembling someone older or younger showed worse EF performance. Age was regressed from both EF and age alteration before plotting. Instead of the actual values, residuals from the regressions were shown here to match our partial correlation analysis. Results from PNC and HBN were shown in blue and green, respectively.
