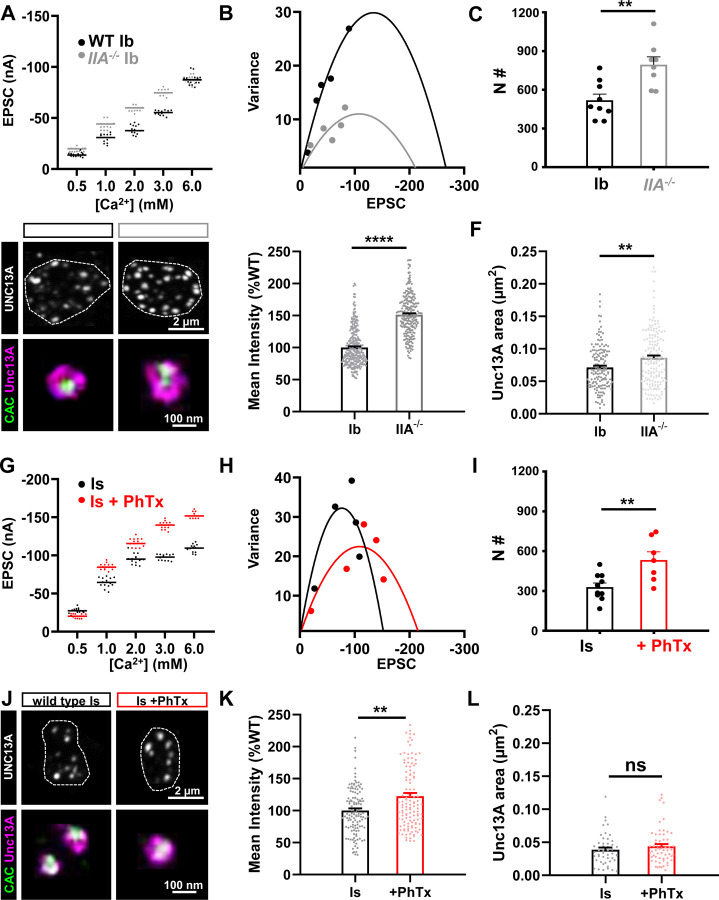
Figure 7: PHP increases functional release sites at both tonic and phasic inputs.
(A) Representative scatter plot of EPSC amplitude distribution from MN-Ib NMJs in wild type and GluRIIA mutants in the indicated extracellular [Ca2+]. (B) Example mean-variance plot for the data shown in (A). Variance was plotted against the mean amplitude of 15 EPSCs from the five Ca2+ concentrations detailed in (A). (C) Estimated number of functional release sites based on mean-variance plots from multiple NMJ recordings, indicating enhanced release sites at MN-Ib after chronic PHP signaling. (D) Representative images of UNC13A and CAC immunostaining at MN-Ib boutons in the indicated genotypes using confocal and STED microscopy. Dashed lines indicate the neuronal membrane. (E) Quantification of UNC13A confocal mean fluorescence intensity in GluRIIA mutants normalized to wild type. (F) Quantification of UNC13A area before or after chronic PHP signaling. Note that both UNC13A area and intensity increase at MN-Ib following chronic PHP. (G-L) Same images and analyses as described in (A-F) at MN-Is boutons of wild type and following PhTx application. Note that acute PHP similarly enhances functional release sites at MN-Is inputs. Error bars indicate ± SEM. Additional statistical details are shown in Table S1.

