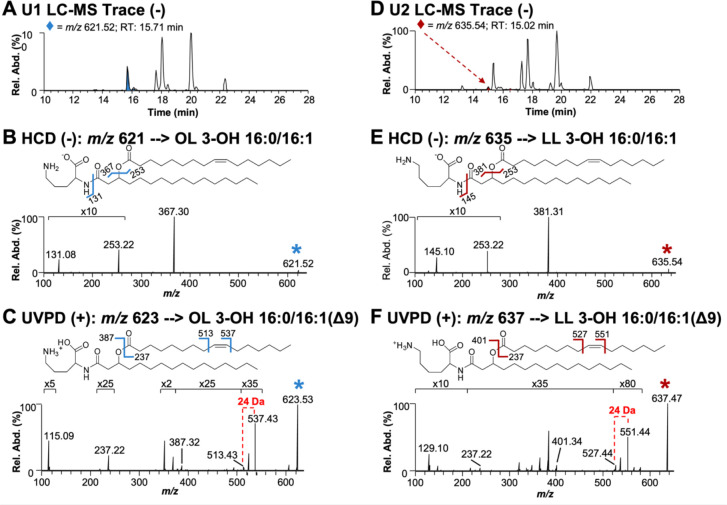
Figure 2: Structural analysis of the lipids produced during phosphate limitation.
A. LC-MS trace of U1 lipid extract in negative-ionization mode. B. HCD (NCE 22) mass spectrum of m/z 621.52 ([M-H]−), an ornithine lipid found in the U1 extract. C. UVPD (4 pulses at 2 mJ/pulse) mass spectrum of m/z 623.53 ([M+H]+). D. LC-MS trace of U2 lipid extract in negative-ionization mode. E. HCD (NCE 22) mass spectrum of m/z 635.54 ([M-H]−), a lysine lipid found in U2 extract. F. UVPD (4 pulses at 2 mJ/pulse) mass spectrum of m/z 637.47 ([M+H]+). The selected precursor ions are labeled with asterisks in B, C, E, and F.

