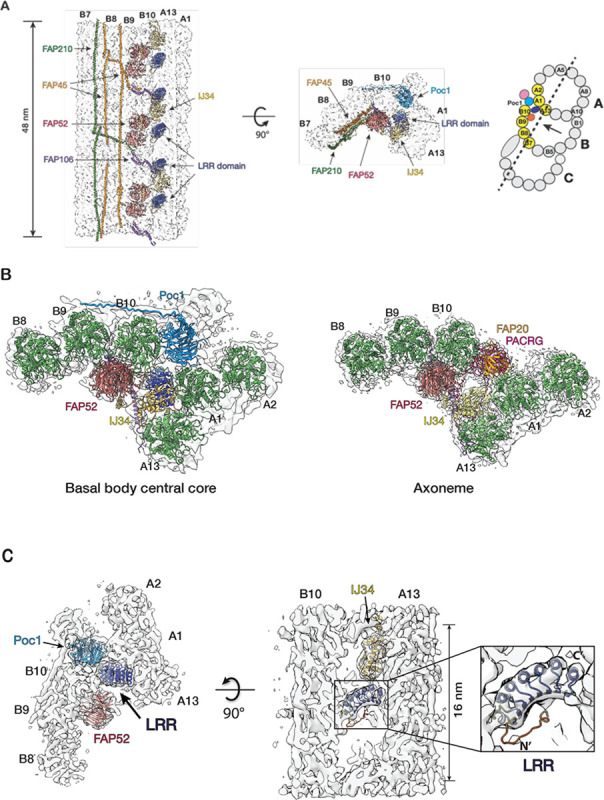
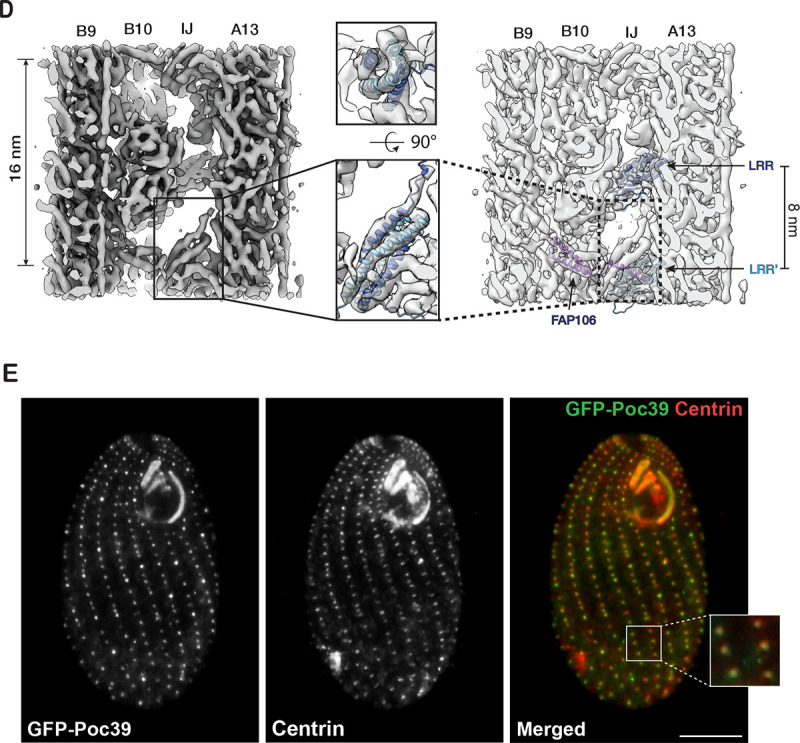
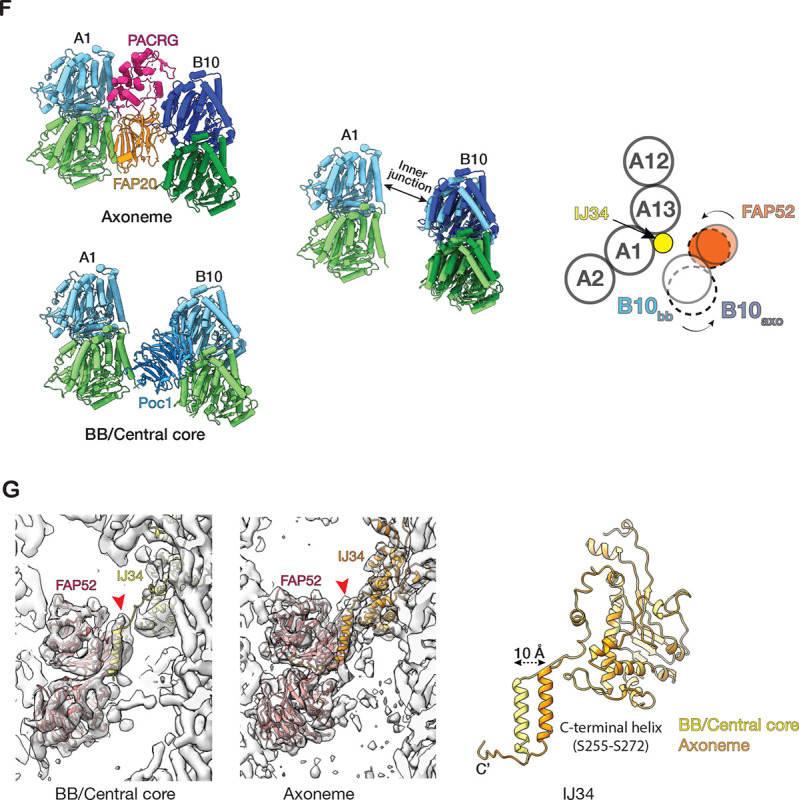
Figure 4.


Structure of the inner Junctions in the central core region of the BB. (A) Two orthogonal views of the 48-nm repeat structure at the A-B inner junction. The pfs shown in the structure are highlighted in yellow in a schematic diagram of the TMT on the right. A dash line indicates the cutting plane and an arrow indicates the direction of the view. (B) Comparing the A-B inner junction from the BB central core region to the axoneme. (C) A MIP with a leucine-rich repeat (LRR) motif in the A-B inner junction. An LRR model predicted by AlphaFold2 from the protein (UniProt: Q22N53) fits into the density map. The LRR motif makes potential interactions with pfs B10, A13, and A1 of the TMT wall, Poc1, and IJ34. (D) An AlphaFold3 predicted model of a right-handed 4-helix bundle fits into the density map. It is formed by two NTDs from the neighboring LRR-containing proteins as an antiparallel dimer. Each monomer is colored in either dark or light blue. (E) Localization of Poc39 to the Tetrahymena BB by fluorescence microscopy. Left: fluorescence signal of GFP-Poc39 expressed in Tetrahymena cell. Center: immunofluorescence signal of a BB protein Centrin in the same cell. Right: merge of the two images on the left. The inset is an enlarged view of a local area showing the colocalization of the GFP-Poc39 (green) and the Centrin (red) signals. Scale bar: 10 μm. (F) Comparing the inner Junctions between the central core region and the axoneme. Left: the models of the inner junction in the central core of BB and the axoneme. Center: superposition of the two models using pf A1 as a reference. Pf B10 (α/β tubulin) in the BB central core are in light green and blue. Pf B10 (α/β tubulin) in the axoneme are dark green and blue. Right: schematic illustration of the change. The solid circles represent the pf B10 and FAP52 from the central core. The dashed circles represent the pf B10 and FAP52 in the axoneme. The two curved arrows indicate the movement of pf B10 and FAP52 from the central core to the axoneme. (G) Comparing the structures of IJ34 in the central core region and the axoneme. The left and center show that IJ34 and FAP52 fit into the density maps. Right: superposition of the two IJ34 using their main domains as a reference. Their C-terminal helices are 10 Å apart.
