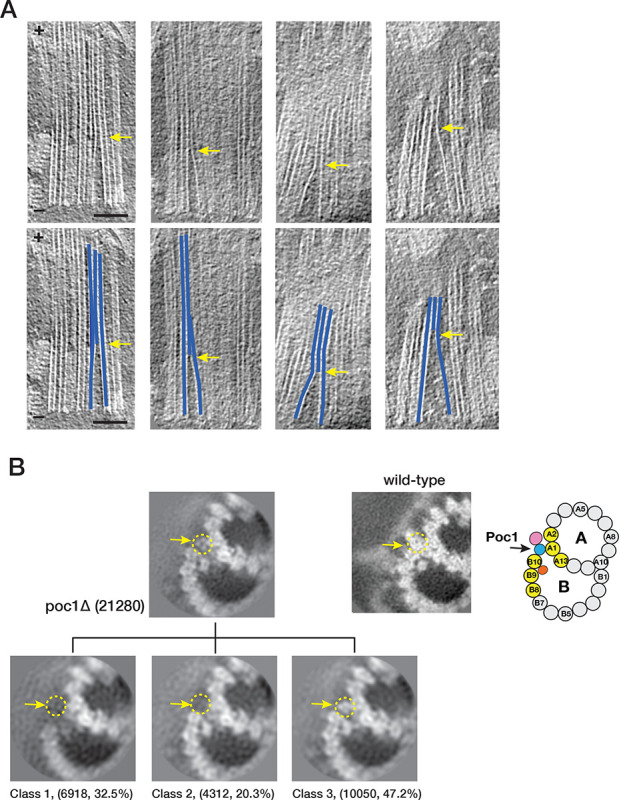
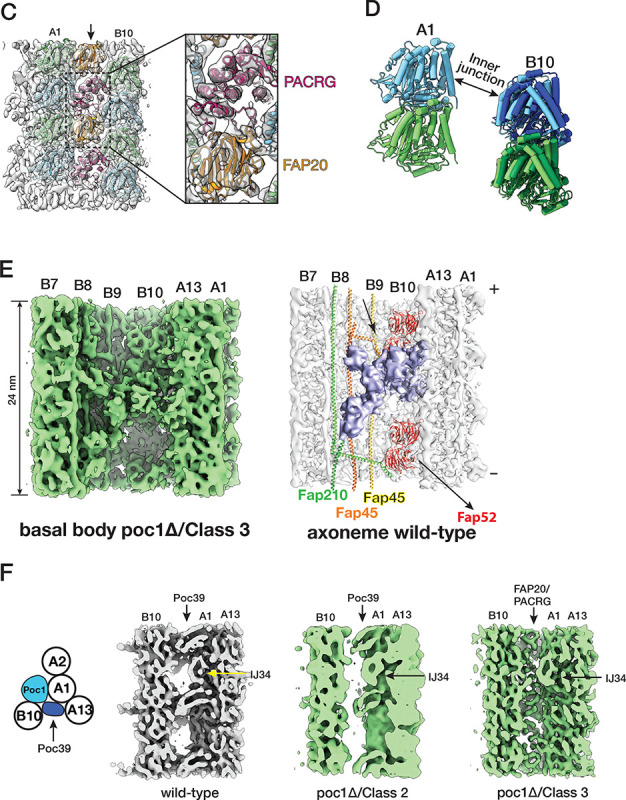
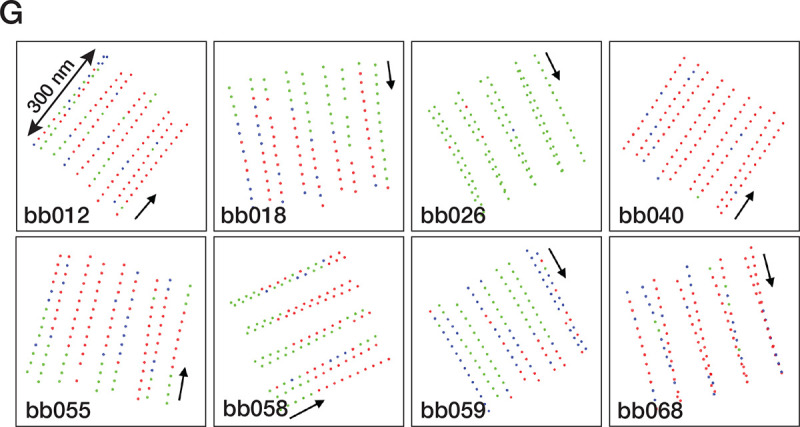
Figure 5.


poc1Δ mutants destabilize the A-B inner junction and allow axonemal components to incorporate into the assembly. (A) Upper: representative tomogram slices from poc1Δ BB show the TMTs split at the A-B inner junction at various longitudinal locations. Bottom: the blue lines highlight the split TMTs in the upper panels. The yellow arrows indicate the splits. The minus ends of TMT are at the bottom, and the plus ends are at the top. Scale bar: 100 nm. (B) 3D classification of subtomograms from poc1Δ BB, focusing on the A-B inner junction. The resulting three subsets show structure variations at the A-B inner junction. In Class 1, the B-tubule is incomplete and detached from the A-tubule at the inner junction. In Class 2, the B-tubule is complete and remains attached to the A-tubule, though the Poc1 position is empty. In Class 3, the B-tubule is complete and connected to the A-tubule, while other proteins occupy the Poc1 site. Yellow dashed circles and arrows outline the position of Poc1 in the wild-type. An image from the wild-type and a schematic diagram is shown for comparison. (C) Further refinement of Class 3 at 8.00 Å shows the FAP20/PACRG filament at the mutant’s inner junction gap. (D) Comparing the A-B inner junction in the central core region between wild-type and poc1Δ Class 3 shows an increased gap in the junction. Pf A1 is used as a reference for superposition. For Pf B10 (α/β tubulin), the wild-type is in light green and blue, and the poc1Δ is in dark green and blue. (E) Focused classification of subtomograms from poc1Δ BB (Class 3) identifies additional axoneme MIP. Left, the mutant structure is shown in green. Right, the inner junction from the wild-type axoneme DMT. The corresponding MIP is colored in lavender. (F) In poc1Δ BB, Poc39 partially remains in the Class 2 average but is absent in Class 3, where the inner junction is occupied by FAP20/PACRG. For comparison, the wild-type structure is shown in grey. (G) Mapping the location of subtomogram from 3 subsets identified in the central core region of poc1Δ BBs. 8 representative BBs are shown. The green dots represent the Class 1 subset, an incomplete B-tubule detached from the A-tubule at the inner junction. The blue dots represent the Class 2 subset, complete B-tubule without Poc1. The red dots represent the Class 3 subset, the axoneme-like inner junction where FAP20/PACRG fills in the space left by Poc1. The arrows point in the direction from the proximal to the distal end of the BBs.
