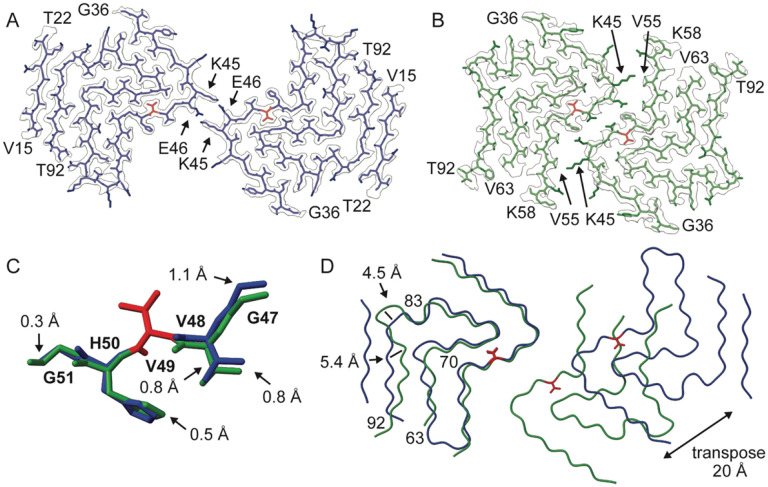
Figure 2: The cryo-EM analysis of Ac-α-syn(A53T) fibrils reveals two distinct polymorphs.
One layer of the fibril structure model in the cryo-EM reconstruction density map of A) polymorph A (blue) and B) polymorph B (green) with V49 highlighted in red and the starting and ending residues of protofilaments interfaces are annotated with arrows. C) local structural variation (G47 to G51) between polymorph A and B when V49 (red) is fixed. D) Overlay of a single layer of polymorph A (blue) and B (green) based on the alignment of the Cα atoms of one protofilament subunit highlight small changes in the protofilament fold between residues 63–70 and 83–92 as well as 20 Å

