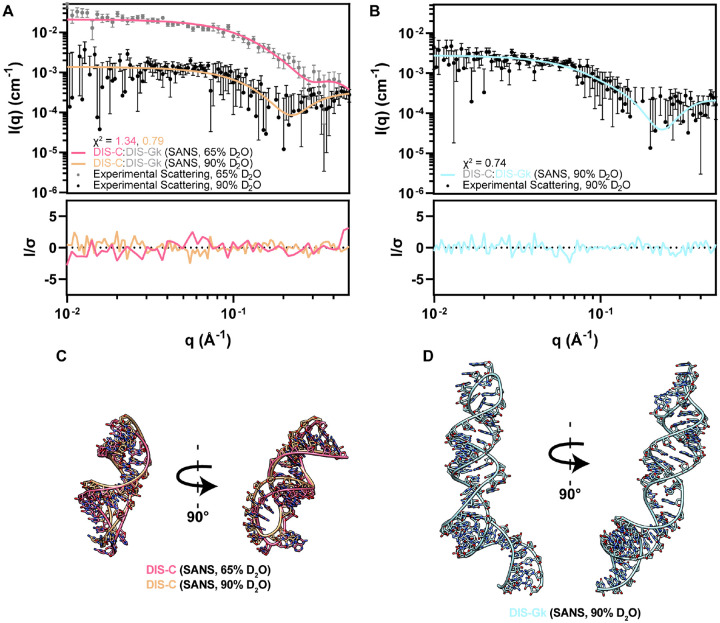
Figure 4. CM-SANS allows for modeling and validation of the DIS RNAs in their bound state.
(A) Experimental scattering of 2H-DIS-C:1H-DIS-Gk in 65% D2O (gray dots) and 1H-DIS-C:2H(42%)-DIS-Gk in 90% D2O (black dots), where DIS-Gk is matched out. Theoretical scattering profiles of DIS-C structural models in (C) are fitted against their respective experimental SANS data. (B) Experimental scattering of 2H(42%)-DIS-C:1H-DIS-Gk in 90% D2O (black dots), where DIS-C is matched out. Theoretical scattering profiles of the DIS-Gk structural model in (D) is fitted against the experimental SANS data. (C) DIS-C structural models using the SANS data as restraints [pink (65% D2O) and light orange (90% D2O)]. (D) DIS-Gk structural model using the SANS data as restraints [light teal (90% D2O)]. q-points without downward error bars in (A) and (B) have a non-positive lower bound, which cannot be shown on a log axis.

