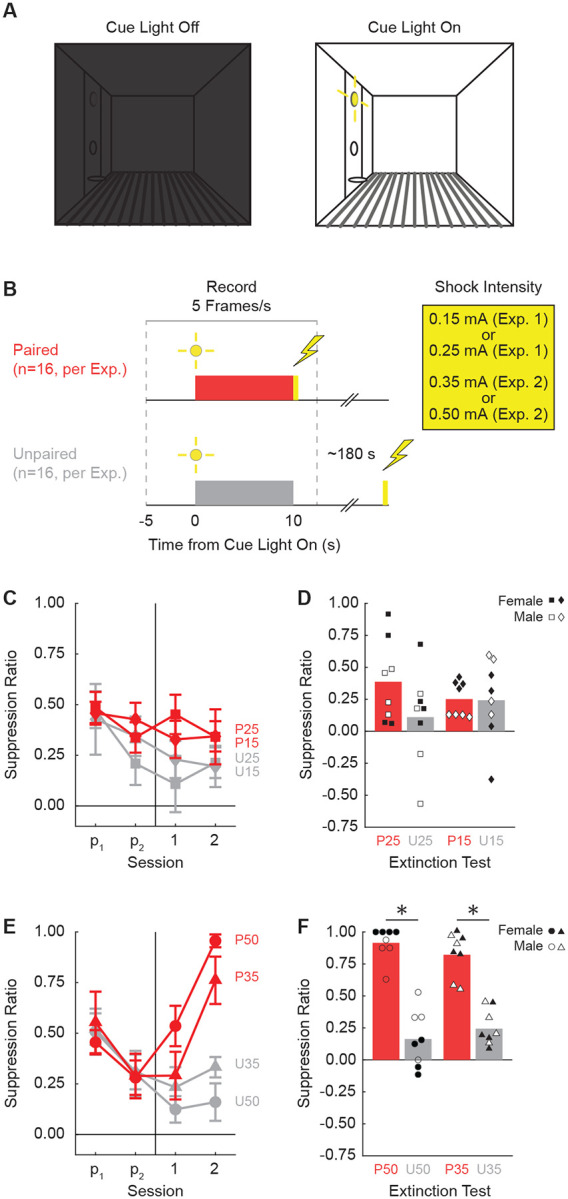
Figure 1.

Experimental design and suppression ratio results.
(A) Behavioral testing took place in a dark, Med Associates chamber equipped with a food cup, port, and cue light on one wall (left). Cue light illumination provided a discrete visual cue in addition to generally illuminating the chamber. (B) Rats in each experiment were divided into Paired (red; n=16) and Unpaired (gray; n=16) conditions. Experiment 1 used foot shock intensities of 0.15 mA and 0.25 mA, while Experiment 2 used foot shock intensities of 0.35 mA and 0.50 mA. (C) Mean ± SEM suppression ratio for Paired (red) and Unpaired (gray) rats receiving 0.25 mA (diamond) or 0.15 mA (square) foot shock over the two pre-exposure sessions (p1 and p2) and the two foot shock sessions (1 and 2) are shown for Experiment 1. Behavior frames were captured every 200 ms, 5 s prior to and 2.5 s following cue light presentation. (D) Group mean (bar) and individual mean (point) suppression ratio for the extinction test are shown for female (closed points) and male (open points), with color and shape meaning from C maintained. Experiment 2 suppression ratio data are shown in E and F. Formatting other than foot shock intensity (0.50 mA, circles; 0.35 mA, triangles) is identical to C and D.
