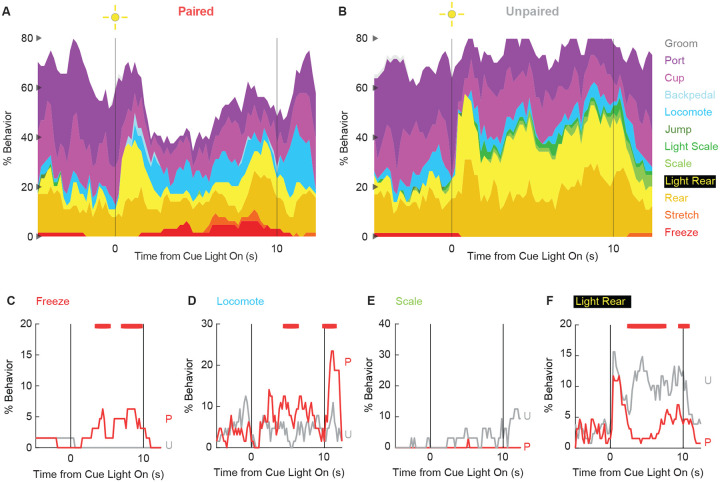
Figure 4.
Extinction ethograms.
(A) Ethogram for paired rats shows % behavior (y axis) for each behavioral category in 200-ms intervals from 5-s prior to cue onset (time 0) to 2.5 s following cue offset (time 10). No shock was delivered during this session. Colors for each behavior category: Freeze (red), Stretch (orange), Rear (mustard), Light Rear (yellow), Scale (light green), Light Scale (green), Jump (dark green), Locomote (cyan), Backpedal (sky blue), Cup (magenta), Port (purple), and Groom (gray). (B) Ethogram for unpaired rats, details identical to paired rats. Line graphs for the 4 behaviors showing a significant group x time interaction are shown in panels C-F. % Behavior is shown for paired rats (P, red) and unpaired rats (U, gray). X axis same as in A/B, y axis scaled to best visualize behavior patterns. Colored bars at the top of each axis indicate 1-s time periods in which paired and unpaired % behavior differed (independent samples t-test, p < 0.05). Red bars indicate greater % behavior in paired rats while gray bars indicate greater % behavior in unpaired rats.

