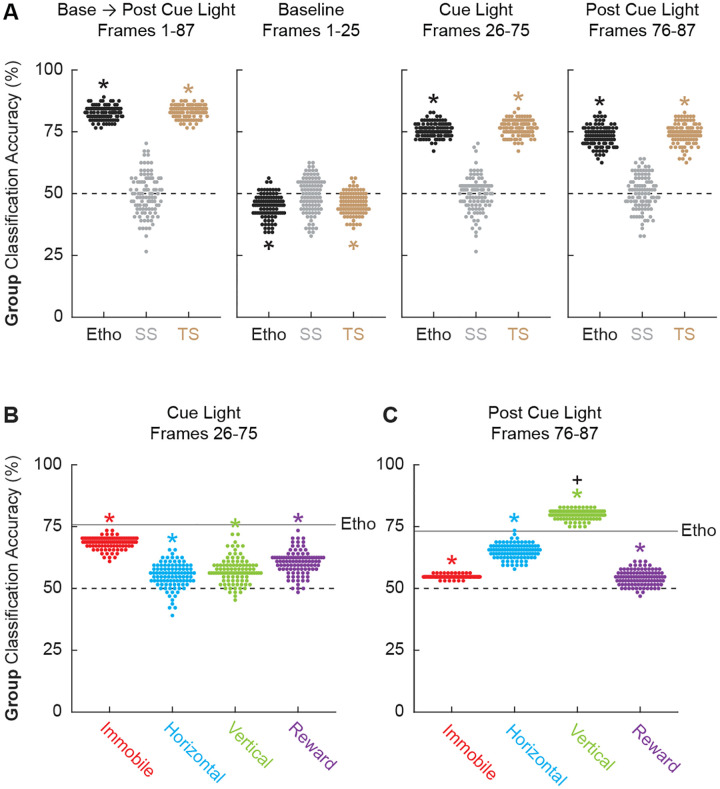
Figure 5.
Linear discriminant analysis results.
(A) Group classification accuracy (paired vs. unpaired) is shown for the total ethogram data (left), baseline (second from left), cue light (second from right), and post cue light (right). Ethogram data were intact (Etho, black), shuffled by session (SS, gray), or shuffled temporally (TS, tan). Each data point represents the accuracy of a single model. The dotted line indicates chance classification. (B) Group classification accuracy for the cue light illumination period is shown for separate, multi-behavior categories (Immobile, red; Horizontal, cyan; Vertical, green; and Reward, purple). The dotted line indicates chance classification while the solid line indicates mean classification accuracy for the total ethogram data during cue light illumination. (C) Group classification accuracy for the post cue period is shown for separate, multi-behavior categories (color as in B). The dotted line indicates chance classification while the solid line indicates mean classification accuracy for the total ethogram data post cue light illumination. *Significance of a one-sample t-test compared to 0.5 (chance). +Significance of an independent-samples t-test comparing Vertical classification to total ethogram classification.

