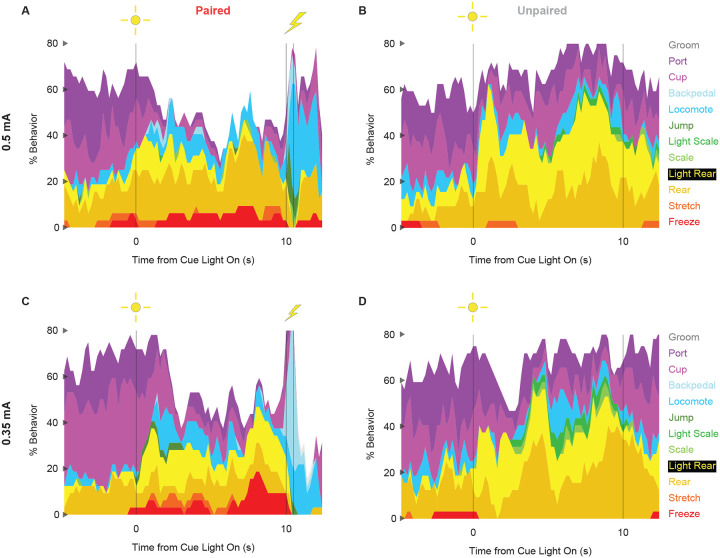
Figure 3 - Supplemental Figure 1 |.
Conditioning ethograms by intensity.
(A) Ethogram for paired rats receiving the 0.5 mA foot shock shows % behavior (y axis) for each behavioral category in 200-ms intervals from 5-s prior to cue onset (time 0) to 2.5 s following cue offset (time 10). Paired rats had shock delivered at cue offset. Colors for each behavior category: Freeze (red), Stretch (orange), Rear (mustard), Light Rear (yellow), Scale (light green), Light Scale (green), Jump (dark green), Locomote (cyan), Backpedal (sky blue), Cup (magenta), Port (purple), and Groom (gray). (B) Ethogram for unpaired rats receiving the 0.5 mA foot shock, details identical to paired rats. Unpaired rats did not receive shock at cue offset. (C & D) Ethogram formatting is identical to A & B but for paired and unpaired rats receiving the 0.35 mA foot shock.

