
Figure 3 - Supplemental Figure 2 |.
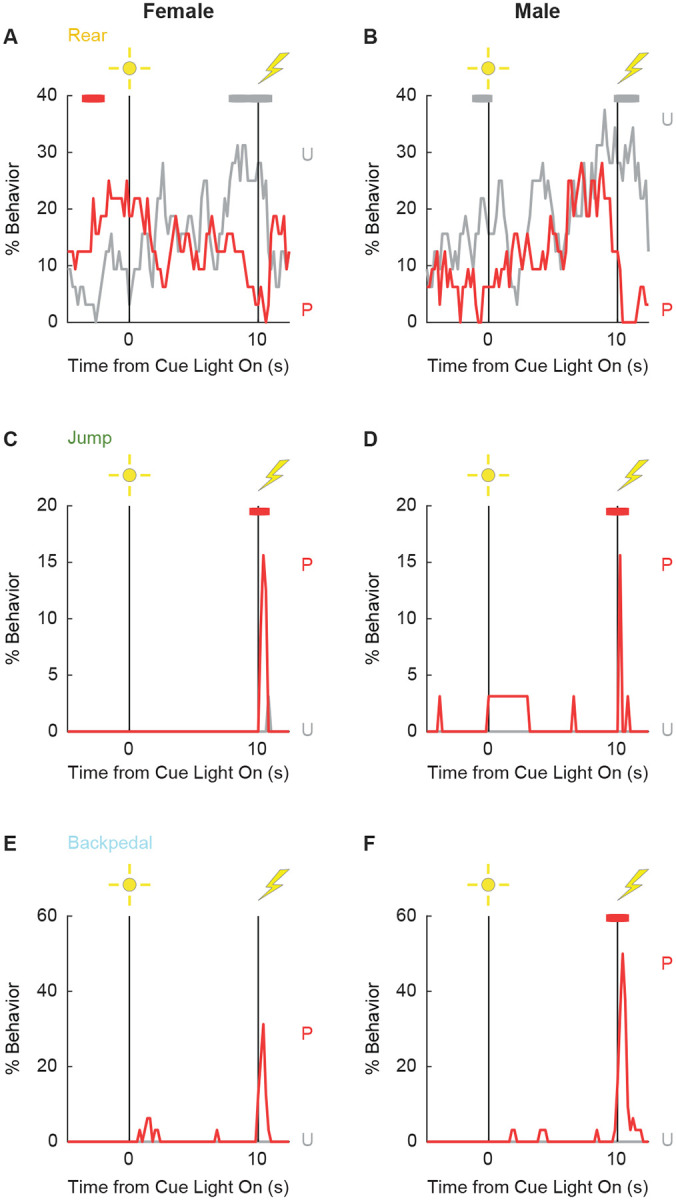
Conditioning line graphs by sex.
Line graphs for the 3 behaviors showing a significant group x time x sex interaction are shown: Rear (A & B), Jump (C & D), and Backpedal (E & F). Females are plotted in the left column and males in the right column. % Behavior is plotted in 200-ms intervals from 5-s prior to cue onset (time 0) to 2.5 s following cue offset (time 10). Paired rats (P, red) and unpaired rats (U, gray). Colored bars at the top of each axis indicate 1-s time periods in which paired and unpaired % behavior differed (independent samples t-test, p < 0.05). Red bars indicate greater behavior in paired rats while gray bars indicate greater behavior in unpaired rats.