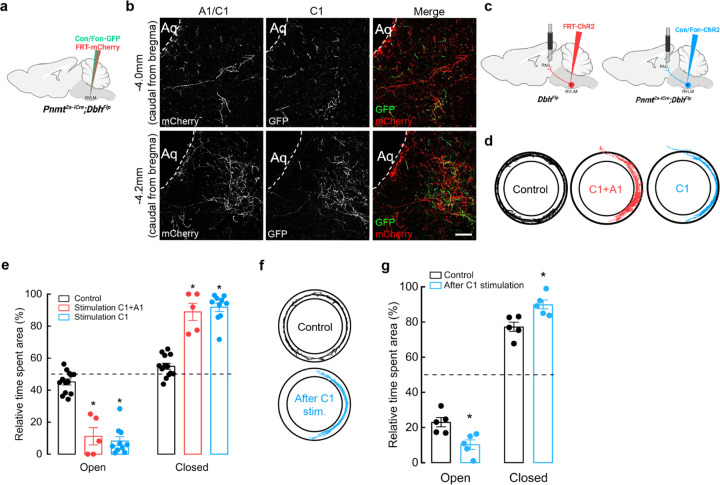
Figure 4. Optogenetic activation of C1 axons innervating vlPAG enhances anxiety-like behaviors.
a, Schematic of viral strategies to label C1 and A1 neurons in RVLM. b, Representative image shows Con/Fon-GFP- and FRT-mCherry-labeled axons in vlPAG (at −4.0 mm and −4.2 mm Bregma). Scale bar: 50 μm. c, Strategy for targeted viral expression of channelrhodopsin (ChR2) in C1+A1 (red) or C1 (blue) neurons and optic fiber implantation in PAG. d, Representative cumulative trajectories (10 min) in the EZM for control (black), C1+A1 (red) and C1 (blue) mice. e, Average percentage of time spent in the open or closed areas of the EZM ((20 Hz, 20 ms pulse width, 30 s stimulation, 30 s rest, 5 min total). f, Representative cumulative trajectories (10 min) in the EZM for control (black) or C1 (blue) mice 7 days post optogenetic stimulation at PAG in their homecage (20 Hz, 20 ms pulse width, 30 s stimulation, 30 s rest, 10 min total). g, Average percentage of time spent in the open or closed areas of the EZM. n=4 animals for b. Control n=13, C1+A1 n=5, C1 n=10 animals for d, e; Control n=5, C1 n=5 for f, g. Data represents mean ± SEM. p<0.05* vs control, Kruskal Wallis test with Dunn’s post hoc test.

