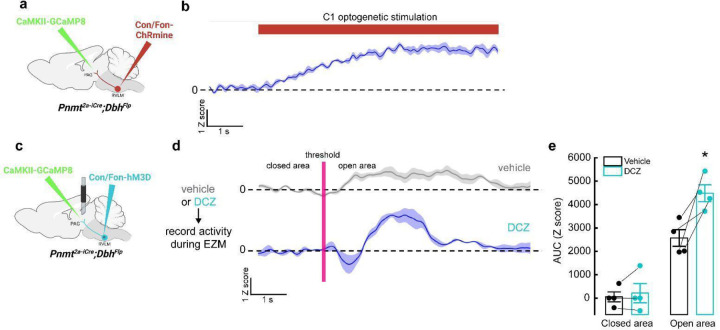
Extended Data Figure 6. Optogenetic and chemogenetic activation of C1 neurons increases excitatory neuron activity in vlPAG.
a, Schematic of the approach for optogenetic activation of C1 neurons while recording bulk calcium responses from excitatory vlPAG neurons. b, Representative average calcium activity of excitatory vlPAG neurons to optogenetic stimulation of C1 neurons (red line, 20 Hz, pulse duration 20 ms, total duration 10 s) under anesthesia. Data represents the mean Z score (dark line) ± SEM (light color) of 3 trials. c, Schematic of the approach for chemogenetic activation of C1 neurons while recording bulk calcium responses from excitatory vlPAG neurons. d, Representative average calcium activity of excitatory vlPAG neurons while mice transition from the closed to the open area of the EZM, in mice pretreated with vehicle (grey) or DCZ (purple). Data represents the mean Z score (dark line) ± SEM (light line) of 3 trials. e, Average AUC analysis of excitatory vlPAG neuron calcium activity from −5 to 0 seconds before crossing the threshold (closed) and from 0 to 5 seconds after entering the open area (open). Data represents mean ± SEM. n=4 animals. *p<0.05, Mann-Whitney U test.

