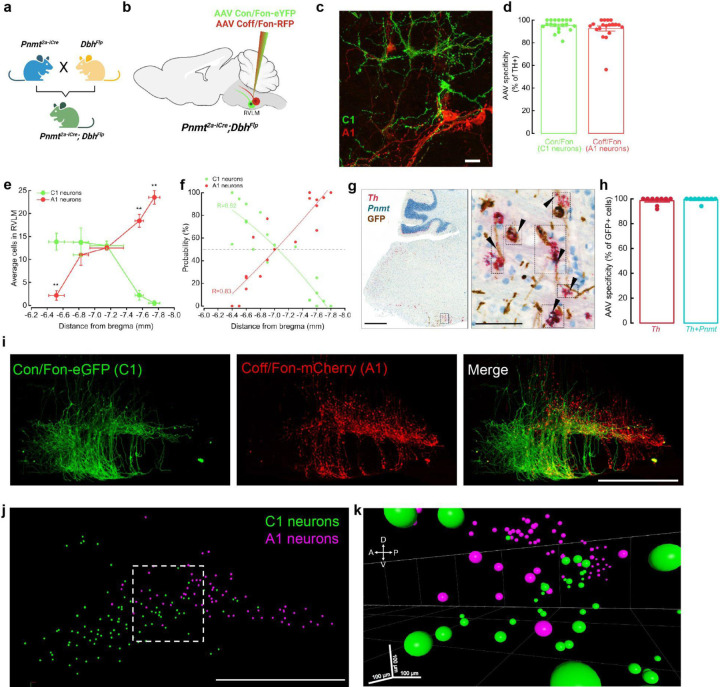
Figure 1. Validation of intersectional approaches to target catecholaminergic C1 neurons.
a, Breeding strategy for Pnmt2a-iCre;DbhFlp mice. b, Schematic of Con/Fon and Coff/Fon viral strategies to label C1 and A1 neurons in RVLM. c, Representative image of GFP+ cells C1 neurons (green) intermingled with mCherry+ A1 neurons (red)(~−6.8 mm from Bregma). Scale bar: 25 μm. d, Average percentage of GFP- or mCherry-labeled cells that co-express TH (n=19 sections from 3 animals). e, Average number of GFP- and mCherry-labeled neurons counted throughout RVLM (n=3 animals). Data represents mean ± SEM. *p<0.05, Kruskal Wallis test with Dunn’s post hoc test. f, Plot showing the estimated probability of C1 or A1 presence throughout RVLM (n=19 sections from 3 animals). g, Representative brightfield images of dual in situ hybridization and immunohistochemistry labeling of RVLM. mRNA probes: Th (red), Pnmt (teal). Antibody: anti-GFP (brown). Scale bars 500 and 100 μm (inset). h, Average percentage of GFP-labeled neurons in RVLM co-expressing Th or Th and Pnmt mRNA (n=9 sections from 3 animals). i, Representative image of Con/Fon-GFP- and Coff/Fon-mCherry-labeled neurons in RVLM of cleared brain tissue (n=3 animals). j, Representative image depicting manual segmentation of C1 and A1 neurons shown in (i). k, 3D image from (j) of C1 (green) and A1 (magenta) neuron segmentation highlights intermingling of these cell types in multiple dimensions.

