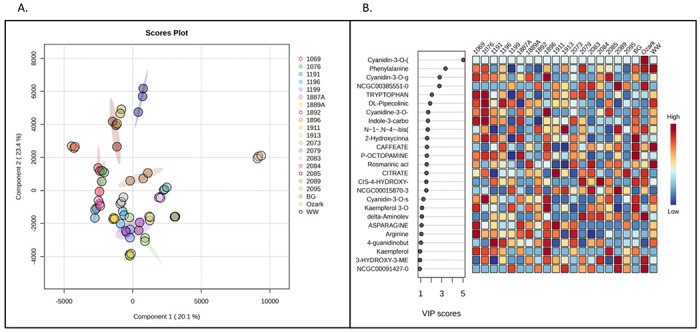
Figure 1.

Partial least-squares discriminant analysis (PLS-DA). A. PLS-DA loading plot of putatively identified compounds in juices of 21 American elderberry genotypes revealed differences in the metabolomic profiles. Circles with the same color represent analytical replicates (n=3). The colored ellipses indicate 95% confidence regions of each group. B. Important features identified by PLS-DA. The colored boxes on the right indicate the relative abundance of the corresponding metabolite in each American elderberry genotype under study, with dark red representing high abundance and dark blue representing low abundance.
