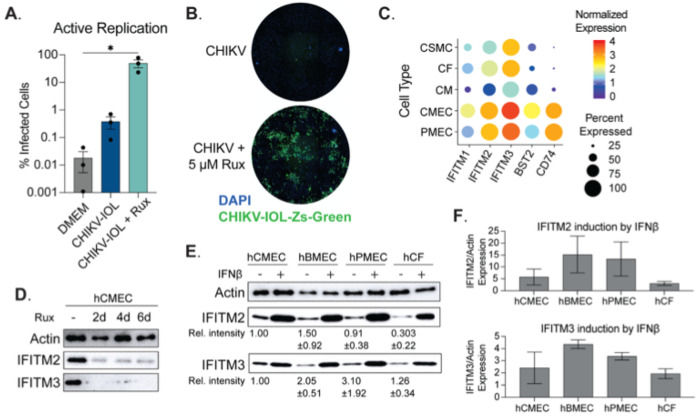
Figure 4. Primary cardiac endothelial cells are susceptible and permissive to CHIKV IOL in absence of JAK/STAT signaling.
(A, B) HCMECs were pre-treated with 5 μM ruxolitinib or mock-treated for 2 days, then infected with CHIKV IOL ZsGreen at a MOI of 0.1 for 1 hour. Post-infection, cells were incubated with media supplemented with or without 5 μM ruxolitinib and fixed for high-content microscopy at 5 dpi. (A) Quantification of percent infected cells as measured by CHIKV-IOL-ZsGreen positive cells relative to number of total cells measured by DAPI staining. (B) Representative images from a CX7 high-content microscope showing cell nuclei stained with DAPI (blue channel) and CHIKV-IOL-ZsGreen infected cells (green channel). (C) Dot plot showing normalized expression levels of IFITM1, IFITM2, IFITM3, BST2, and CD74 in cardiac and endothelial cell types using the Tabula Sapiens dataset. (D and E) Representative images of western blots visualizing actin, IFITM2, and IFITM3 protein levels. (D) HCMECs were treated with 5 μM ruxolitinib for 2, 4, or 6 days or mock-treated. Cells were collected in laemmli buffer, proteins were separated by SDS-PAGE and visualized by immunoblotting. (E, F) HCMECs, hBMECs, hPMECs, and hCFs were treated with IFNβ or mock-treated for 24 hours. Cells were harvested and proteins analyzed as described above. (E) Values indicate relative intensity of expression as compared to hCMEC basal expression, with SD. (F) Quantified IFITM2 and IFITM3 expression after 24 hours IFNβ treatment. Data represents the mean of n = 3 independent trials in technical triplicate (A, B) with error bars showing the SEM and the limit of detection indicated by the gray shaded area. Western blots represent at least n = 2 independent trials (D-F). Statistical significance (A) was found by a Kruskal-Wallis test with multiple comparisons, with p-values representing *p<0.05.

