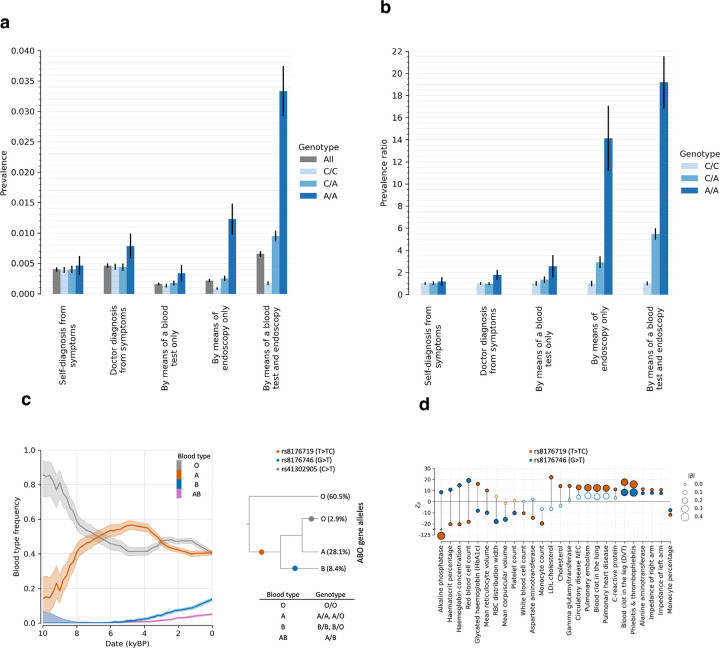
Extended Data Figure 6: Genotype-phenotype correlations for the signals of selection for Celiac disease at HLA and the ABO blood group locus.
(a) Prevalence and (b) prevalence ratio of individuals with celiac disease or gluten sensitivity (data field 21068) in the UK Biobank, conditioned on the genotype of rs3891176 (C>A). The prevalence ratio compared to the A/A genotype as a baseline; bars are 95% confidence intervals. (c) Left: Blood type frequency trajectories for O, A, B, and AB estimated from our aDNA time series. Right: Genealogy of the ABO alleles approximated by Shelton et al. 2021220. The allele frequencies are estimated from Europeans in the 1000 Genomes Project; shading gives 95% confidence interval. (d) Significant association to traits in Pan-UKBB for the two base pair insertion rs8176719 (T>TC) and SNP rs8176746 (G>T), approximating the alleles A and B.

