
Extended Data Figure 9: Pigmentation is oligogenic but selection on it was polygenic.
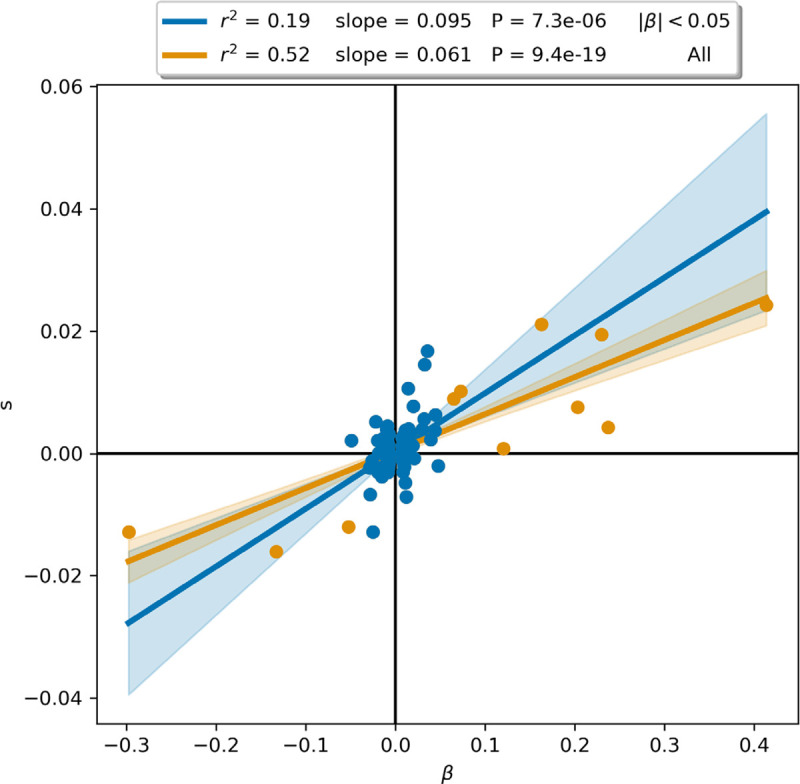
Selection coefficient () and effect size () from the pan-UKBB skin color phenotype for 110 independent SNPs passing the GWAS P-value threshold of p<5×10⁻⁸. Following 57, the orange line is a linear regression on all SNPs (99 blue and 11 orange markers), while the blue line includes only SNPs with (99 blue markers). Although the correlation appears different (with the difference between Fisher Z-transformed Pearson r showing a P-value of 0.001), the slopes are not significantly different (P = 0.10), consistent with a model in which selection for pigmentation had an equal impact on all variants in proportion to effect size.